d3-legend与React/Vue集成教程:现代化前端框架中的图例应用指南
【免费下载链接】d3-legend A reusable d3 legend component.  项目地址: https://gitcode.com/gh_mirrors/d3/d3-legend
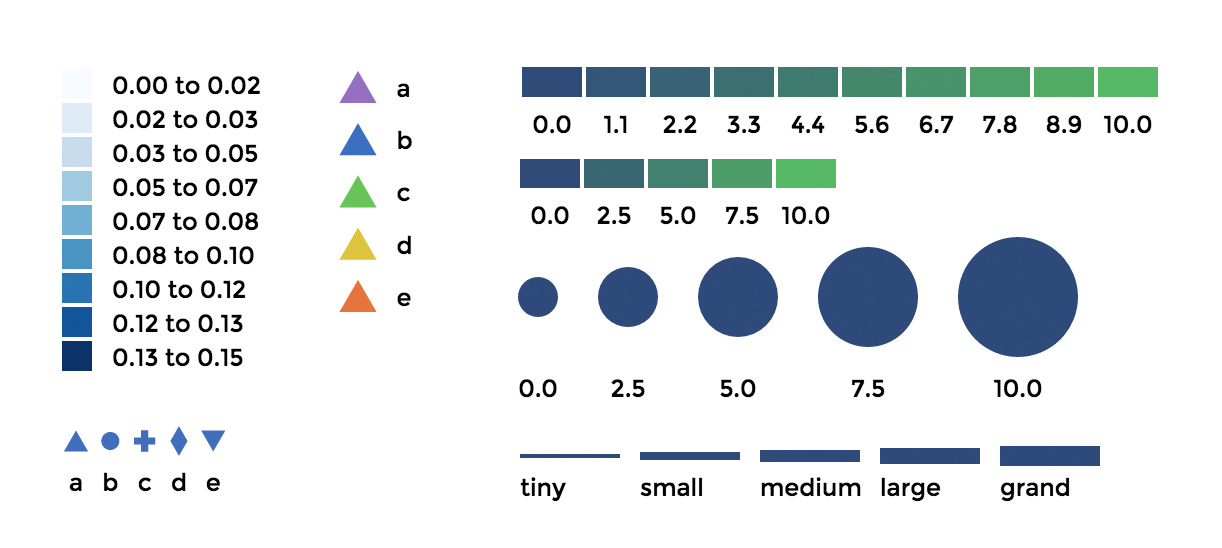
在数据可视化领域,d3-legend是一个功能强大的可复用图例组件库,它为D3.js图表提供了专业级的图例支持。这个强大的d3图例组件能够轻松创建颜色图例、大小图例和符号图例,是现代数据可视化项目中不可或缺的工具。对于使用React或Vue等现代化前端框架的开发者来说,掌握d3-legend的集成技巧能够显著提升数据可视化的专业性和用户体验。😊
为什么选择d3-legend进行前端框架集成?
d3-legend提供了三种核心图例类型:颜色图例、大小图例和符号图例,每种类型都支持丰富的配置选项。通过legendColor()、legendSize()和legendSymbol()这三个主要函数,开发者可以快速创建符合项目需求的图例组件。
主要优势包括:
- 🔧 高度可配置:支持方向、形状、标签格式、标题等多项定制
- 📊 与D3无缝集成:直接使用D3比例尺作为输入
- 🎨 多种图例类型:满足不同类型的数据可视化需求
- 🚀 轻量级:体积小巧,不影响应用性能
快速安装与项目配置
首先,我们需要在React或Vue项目中安装d3-legend。可以通过npm或yarn进行安装:
npm install d3-svg-legend d3
# 或
yarn add d3-svg-legend d3
对于TypeScript项目,类型定义文件位于types/d3-svg-legend.d.ts,提供了完整的类型支持,确保在React和Vue项目中的类型安全。
React集成方案:创建可复用的图例组件
在React项目中集成d3-legend,最佳实践是创建可复用的图例组件。下面是一个完整的React颜色图例组件实现:
基础React图例组件
import React, { useEffect, useRef } from 'react';
import * as d3 from 'd3';
import { legendColor } from 'd3-svg-legend';
const ColorLegend = ({ scale, width = 200, height = 300, title = '' }) => {
const svgRef = useRef(null);
useEffect(() => {
if (!svgRef.current || !scale) return;
const svg = d3.select(svgRef.current);
svg.selectAll('*').remove(); // 清除之前的图例
const legendGroup = svg.append('g')
.attr('class', 'legend-color')
.attr('transform', `translate(20, 20)`);
const colorLegend = legendColor()
.title(title)
.labelFormat(d3.format('.2f'))
.scale(scale);
legendGroup.call(colorLegend);
}, [scale, title]);
return (
<svg
ref={svgRef}
width={width}
height={height}
className="d3-legend-container"
/>
);
};
export default ColorLegend;
高级React图例配置示例
在React中,我们可以充分利用组件的props来动态配置图例。以下示例展示了如何创建一个支持多种配置的通用图例组件:
import React, { useEffect, useRef } from 'react';
import * as d3 from 'd3';
import { legendColor, legendSize, legendSymbol } from 'd3-svg-legend';
const D3Legend = ({
type = 'color',
scale,
config = {},
onCellClick,
className = ''
}) => {
const containerRef = useRef(null);
useEffect(() => {
if (!containerRef.current || !scale) return;
const svg = d3.select(containerRef.current);
svg.selectAll('*').remove();
let legend;
switch(type) {
case 'color':
legend = legendColor();
break;
case 'size':
legend = legendSize();
break;
case 'symbol':
legend = legendSymbol();
break;
default:
legend = legendColor();
}
// 应用配置
Object.keys(config).forEach(key => {
if (legend[key] && typeof legend[key] === 'function') {
legendkey;
}
});
// 添加事件监听
if (onCellClick) {
legend.on('cellclick', onCellClick);
}
svg.append('g')
.attr('class', `legend-${type}`)
.attr('transform', 'translate(20, 20)')
.call(legend.scale(scale));
}, [type, scale, config, onCellClick]);
return (
<div className={`d3-legend-wrapper ${className}`}>
<svg ref={containerRef} />
</div>
);
};
export default D3Legend;
Vue集成方案:构建响应式图例组件
在Vue 3中,我们可以使用Composition API来创建响应式的d3-legend组件。以下是完整的Vue实现:
Vue 3 Composition API实现
<template>
<div class="d3-legend-container" ref="containerRef"></div>
</template>
<script setup>
import { ref, watch, onMounted, onUnmounted } from 'vue';
import * as d3 from 'd3';
import { legendColor } from 'd3-svg-legend';
const props = defineProps({
scale: {
type: Object,
required: true
},
orientation: {
type: String,
default: 'vertical',
validator: value => ['vertical', 'horizontal'].includes(value)
},
title: {
type: String,
default: ''
},
width: {
type: Number,
default: 250
},
height: {
type: Number,
default: 400
}
});
const containerRef = ref(null);
let svg = null;
let legendGroup = null;
const renderLegend = () => {
if (!containerRef.value || !props.scale) return;
// 清除之前的渲染
d3.select(containerRef.value).selectAll('*').remove();
svg = d3.select(containerRef.value)
.append('svg')
.attr('width', props.width)
.attr('height', props.height);
legendGroup = svg.append('g')
.attr('class', 'legend-color')
.attr('transform', 'translate(20, 30)');
const legend = legendColor()
.title(props.title)
.orient(props.orientation)
.labelFormat(d3.format('.2f'))
.scale(props.scale);
legendGroup.call(legend);
};
// 监听属性变化
watch(() => [props.scale, props.orientation, props.title], () => {
renderLegend();
}, { deep: true });
onMounted(() => {
renderLegend();
});
onUnmounted(() => {
if (svg) {
svg.remove();
}
});
</script>
<style scoped>
.d3-legend-container {
font-family: 'Segoe UI', sans-serif;
}
</style>
Vue 2选项式API实现
对于Vue 2项目,可以使用传统的选项式API:
<template>
<div class="d3-legend" ref="legendContainer"></div>
</template>
<script>
import * as d3 from 'd3';
import { legendColor, legendSize } from 'd3-svg-legend';
export default {
name: 'D3Legend',
props: {
legendType: {
type: String,
default: 'color',
validator: value => ['color', 'size', 'symbol'].includes(value)
},
scale: {
type: Object,
required: true
},
config: {
type: Object,
default: () => ({})
}
},
data() {
return {
svg: null,
legend: null
};
},
watch: {
scale: {
handler() {
this.renderLegend();
},
deep: true
},
config: {
handler() {
this.renderLegend();
},
deep: true
}
},
mounted() {
this.renderLegend();
},
beforeDestroy() {
this.cleanup();
},
methods: {
renderLegend() {
this.cleanup();
if (!this.$refs.legendContainer || !this.scale) return;
const container = d3.select(this.$refs.legendContainer);
container.selectAll('*').remove();
this.svg = container.append('svg')
.attr('width', this.config.width || 300)
.attr('height', this.config.height || 200);
let legend;
switch(this.legendType) {
case 'color':
legend = legendColor();
break;
case 'size':
legend = legendSize();
break;
default:
legend = legendColor();
}
// 应用配置
Object.keys(this.config).forEach(key => {
if (legend[key] && typeof legend[key] === 'function') {
legendkey;
}
});
const legendGroup = this.svg.append('g')
.attr('class', `legend-${this.legendType}`)
.attr('transform', 'translate(20, 20)');
legendGroup.call(legend.scale(this.scale));
this.legend = legend;
},
cleanup() {
if (this.svg) {
this.svg.remove();
this.svg = null;
}
}
}
};
</script>
实战应用:完整的数据可视化案例
让我们通过一个完整的示例来展示如何在React/Vue项目中实际应用d3-legend:
创建颜色图例示例
// React示例:创建温度图例
import React from 'react';
import * as d3 from 'd3';
import ColorLegend from './ColorLegend';
const TemperatureChart = () => {
const temperatureScale = d3.scaleSequential()
.domain([-20, 40]) // 温度范围:-20°C 到 40°C
.interpolator(d3.interpolateRgbBasis([
'#2c7bb6', // 冷色
'#abd9e9',
'#ffffbf',
'#fdae61',
'#d7191c' // 暖色
]));
const legendConfig = {
title: '温度 (°C)',
orient: 'vertical',
shapeWidth: 30,
shapeHeight: 20,
labelFormat: d3.format('.0f'),
cells: 7
};
return (
<div className="temperature-chart">
<h3>全球温度分布图</h3>
<div className="chart-container">
{/* 图表内容 */}
</div>
<div className="legend-container">
<ColorLegend
scale={temperatureScale}
config={legendConfig}
width={150}
height={300}
/>
</div>
</div>
);
};
创建大小图例示例
<!– Vue示例:创建人口大小图例 –>
<template>
<div class="population-map">
<h3>城市人口分布</h3>
<div class="map-container">
<!– 地图SVG –>
</div>
<D3Legend
:scale="populationScale"
:config="legendConfig"
legend-type="size"
@cell-click="handleLegendClick"
/>
</div>
</template>
<script setup>
import { computed } from 'vue';
import * as d3 from 'd3';
const populationData = [/* 人口数据 */];
const populationScale = computed(() => {
const maxPopulation = Math.max(…populationData.map(d => d.population));
return d3.scaleSqrt()
.domain([0, maxPopulation])
.range([5, 40]); // 圆点半径范围
});
const legendConfig = {
title: '人口规模',
orient: 'horizontal',
shape: 'circle',
labelFormat: d3.format(',.0f'),
cells: 5
};
const handleLegendClick = (d) => {
console.log('图例点击:', d);
// 处理点击事件,如筛选数据
};
</script>
高级配置与最佳实践
1. 响应式设计技巧
确保图例在不同屏幕尺寸下都能正常显示:
// React响应式图例组件
const ResponsiveLegend = ({ scale, config }) => {
const containerRef = useRef(null);
const [dimensions, setDimensions] = useState({ width: 300, height: 200 });
useEffect(() => {
const updateDimensions = () => {
if (containerRef.current) {
const { width } = containerRef.current.getBoundingClientRect();
setDimensions({
width: Math.min(width, 400),
height: width > 768 ? 250 : 180
});
}
};
updateDimensions();
window.addEventListener('resize', updateDimensions);
return () => window.removeEventListener('resize', updateDimensions);
}, []);
return (
<div ref={containerRef} className="responsive-legend">
<ColorLegend
scale={scale}
config={config}
width={dimensions.width}
height={dimensions.height}
/>
</div>
);
};
2. 性能优化建议
- 🚀 使用useMemo缓存比例尺:避免在每次渲染时重新创建D3比例尺
- ⚡ 延迟渲染:对于复杂的图例,考虑使用React.lazy或Vue异步组件
- 🎯 事件委托:使用事件委托处理图例交互,减少事件监听器数量
- 🔄 避免不必要的重渲染:使用React.memo或Vue的computed属性
3. 主题与样式定制
通过CSS变量或主题系统实现动态样式:
/* 全局图例样式 */
.d3-legend-container {
–legend-primary-color: #2c3e50;
–legend-secondary-color: #ecf0f1;
–legend-accent-color: #3498db;
}
.legend-color .legend-title {
font-size: 14px;
font-weight: 600;
fill: var(–legend-primary-color);
}
.legend-color .legend-label {
font-size: 12px;
fill: var(–legend-primary-color);
}
/* 暗色主题 */
.dark-theme .d3-legend-container {
–legend-primary-color: #ecf0f1;
–legend-secondary-color: #2c3e50;
}
常见问题与解决方案
Q1: 图例不显示或显示异常
解决方案:检查D3比例尺是否正确初始化,确保在组件挂载后再渲染图例
Q2: 图例位置不正确
解决方案:使用transform属性调整图例位置,或通过CSS定位容器
Q3: 响应式布局问题
解决方案:监听容器尺寸变化,动态调整图例配置
Q4: 与TypeScript的类型冲突
解决方案:确保导入正确的类型定义,检查types/d3-svg-legend.d.ts文件
总结与进阶学习
通过本教程,你已经掌握了d3-legend在React和Vue项目中的集成方法。这个强大的d3图例组件能够显著提升数据可视化项目的专业性和用户体验。🎯
下一步学习建议:
记住,良好的图例设计不仅提升视觉效果,更能帮助用户更好地理解数据。d3-legend作为专业的图例解决方案,为你的数据可视化项目提供了坚实的基础。✨
通过本教程的实践,你将能够轻松在React和Vue项目中集成d3-legend,创建出既美观又实用的数据可视化应用。开始你的数据可视化之旅吧!🚀
【免费下载链接】d3-legend A reusable d3 legend component. 项目地址: https://gitcode.com/gh_mirrors/d3/d3-legend
创作声明:本文部分内容由AI辅助生成(AIGC),仅供参考