Prometheus监控物理服务器
一、Prometheus介绍
Prometheus(普罗米修斯)是一套开源的监控&报警&时间序列数据库的组合, 由go语言开发。适合监控容器平台, 因为kubernetes(俗称k8s)的流行带动了prometheus的发展。 PS:使用prometheus监控仍然监控物理服务器。
官方网站: https://prometheus.io/

二、Prometheus监控
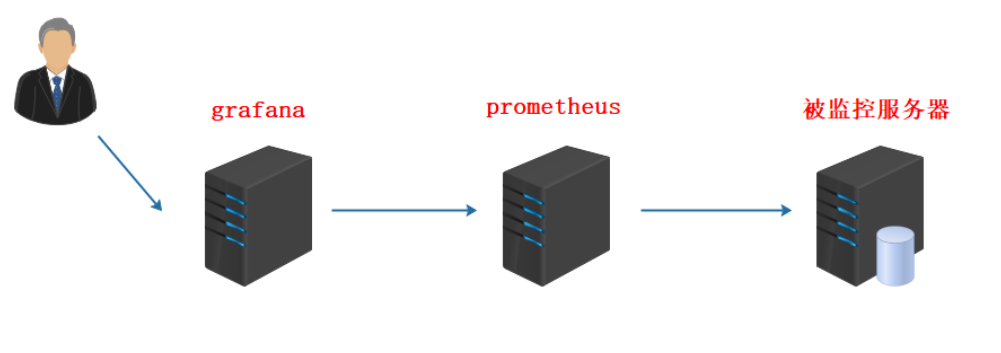
实验环境准备
1、所有服务器静态ip(要求能上外网),所有服务器各配置主机名并绑定
//各自配置好主机名
[root@stw ~]# hostnamectl set-hostname grafana.example.com
[root@stw ~]# bash
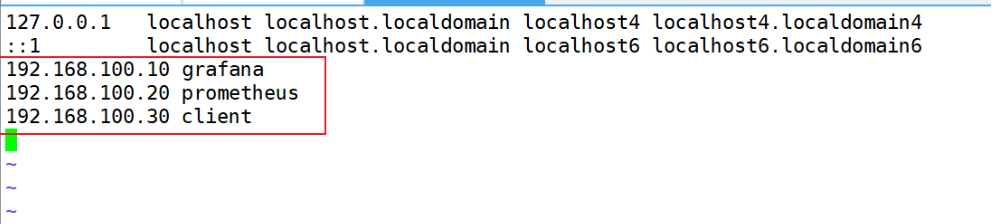
//三台都互相绑定IP与主机名
[root@grafana ~]# vim /etc/hosts
2、所有服务器时间同步(时间同步一定要做)
[root@client ~]# systemctl restart chronyd
[root@client ~]# systemctl enable chronyd
[root@client ~]# systemctl status firewalld.service
3、所有服务器关闭防火墙,selinux
[root@client ~]# systemctl status firewalld.service
● firewalld.service – firewalld – dynamic firewall daemon
Loaded: loaded (/usr/lib/systemd/system/firewalld.service; disabled; vendor preset: enabled)
Active: inactive (dead)
Docs: man:firewalld(1)
[root@client ~]# getenforce
Disabled
安装Prometheus
下载地址: https://prometheus.io/download/ (请使用共享的软件版本,以免出现不兼容问题)
1、二进制版解压就能用,不需要编译
[root@prometheus ~]# rz -E
rz waiting to receive.
[root@prometheus ~]# ls
anaconda–ks.cfg Downloads Pictures Templates
Desktop initial–setup–ks.cfg prometheus–2.54.0.linux–amd64.tar.gz Videos
Documents Music Public
[root@prometheus ~]# tar -zxvf prometheus-2.54.0.linux-amd64.tar.gz -C /usr/local/
[root@prometheus ~]# cd /usr/local
[root@prometheus local]# ls
bin games lib libexec sbin src
etc include lib64 prometheus–2.54.0.linux–amd64 share
[root@prometheus ~]# mv /usr/local/prometheus-2.54.0.linux-amd64/ /usr/local/prometheus
[root@prometheus ~]# cd /usr/local/
[root@prometheus local]# ls
bin etc games include lib lib64 libexec prometheus sbin share src
[root@prometheus local]# cd prometheus/
[root@prometheus prometheus]# ls
console_libraries consoles LICENSE NOTICE prometheus prometheus.yml promtool
配置文件说明
[root@prometheus ~]# cd /usr/local/prometheus/
[root@prometheus prometheus]# ls
console_libraries consoles LICENSE NOTICE prometheus prometheus.yml promtool
[root@prometheus prometheus]# vim prometheus.yml
2:global: //全局配置段
3: scrape_interval: 15s //每15s抓取(采集)数据一次
4: evaluation_interval: 15s //每15秒计算一次规则
8:alerting: //Alertmanager报警相关
9: alertmanagers:
10: – static_configs:
11: