在互联网大厂,服务器监控(AIOps)是基础设施的命脉。一旦核心数据库或网关宕机,每分钟的损失可能高达数百万。

传统的监控方案(如 Zabbix、Prometheus)在面对海量指标时各有痛点:Zabbix 擅长告警但历史数据存储能力弱;Prometheus 查询语言(PromQL)学习曲线陡峭且不易与业务数据(如 CMDB)进行关联分析。
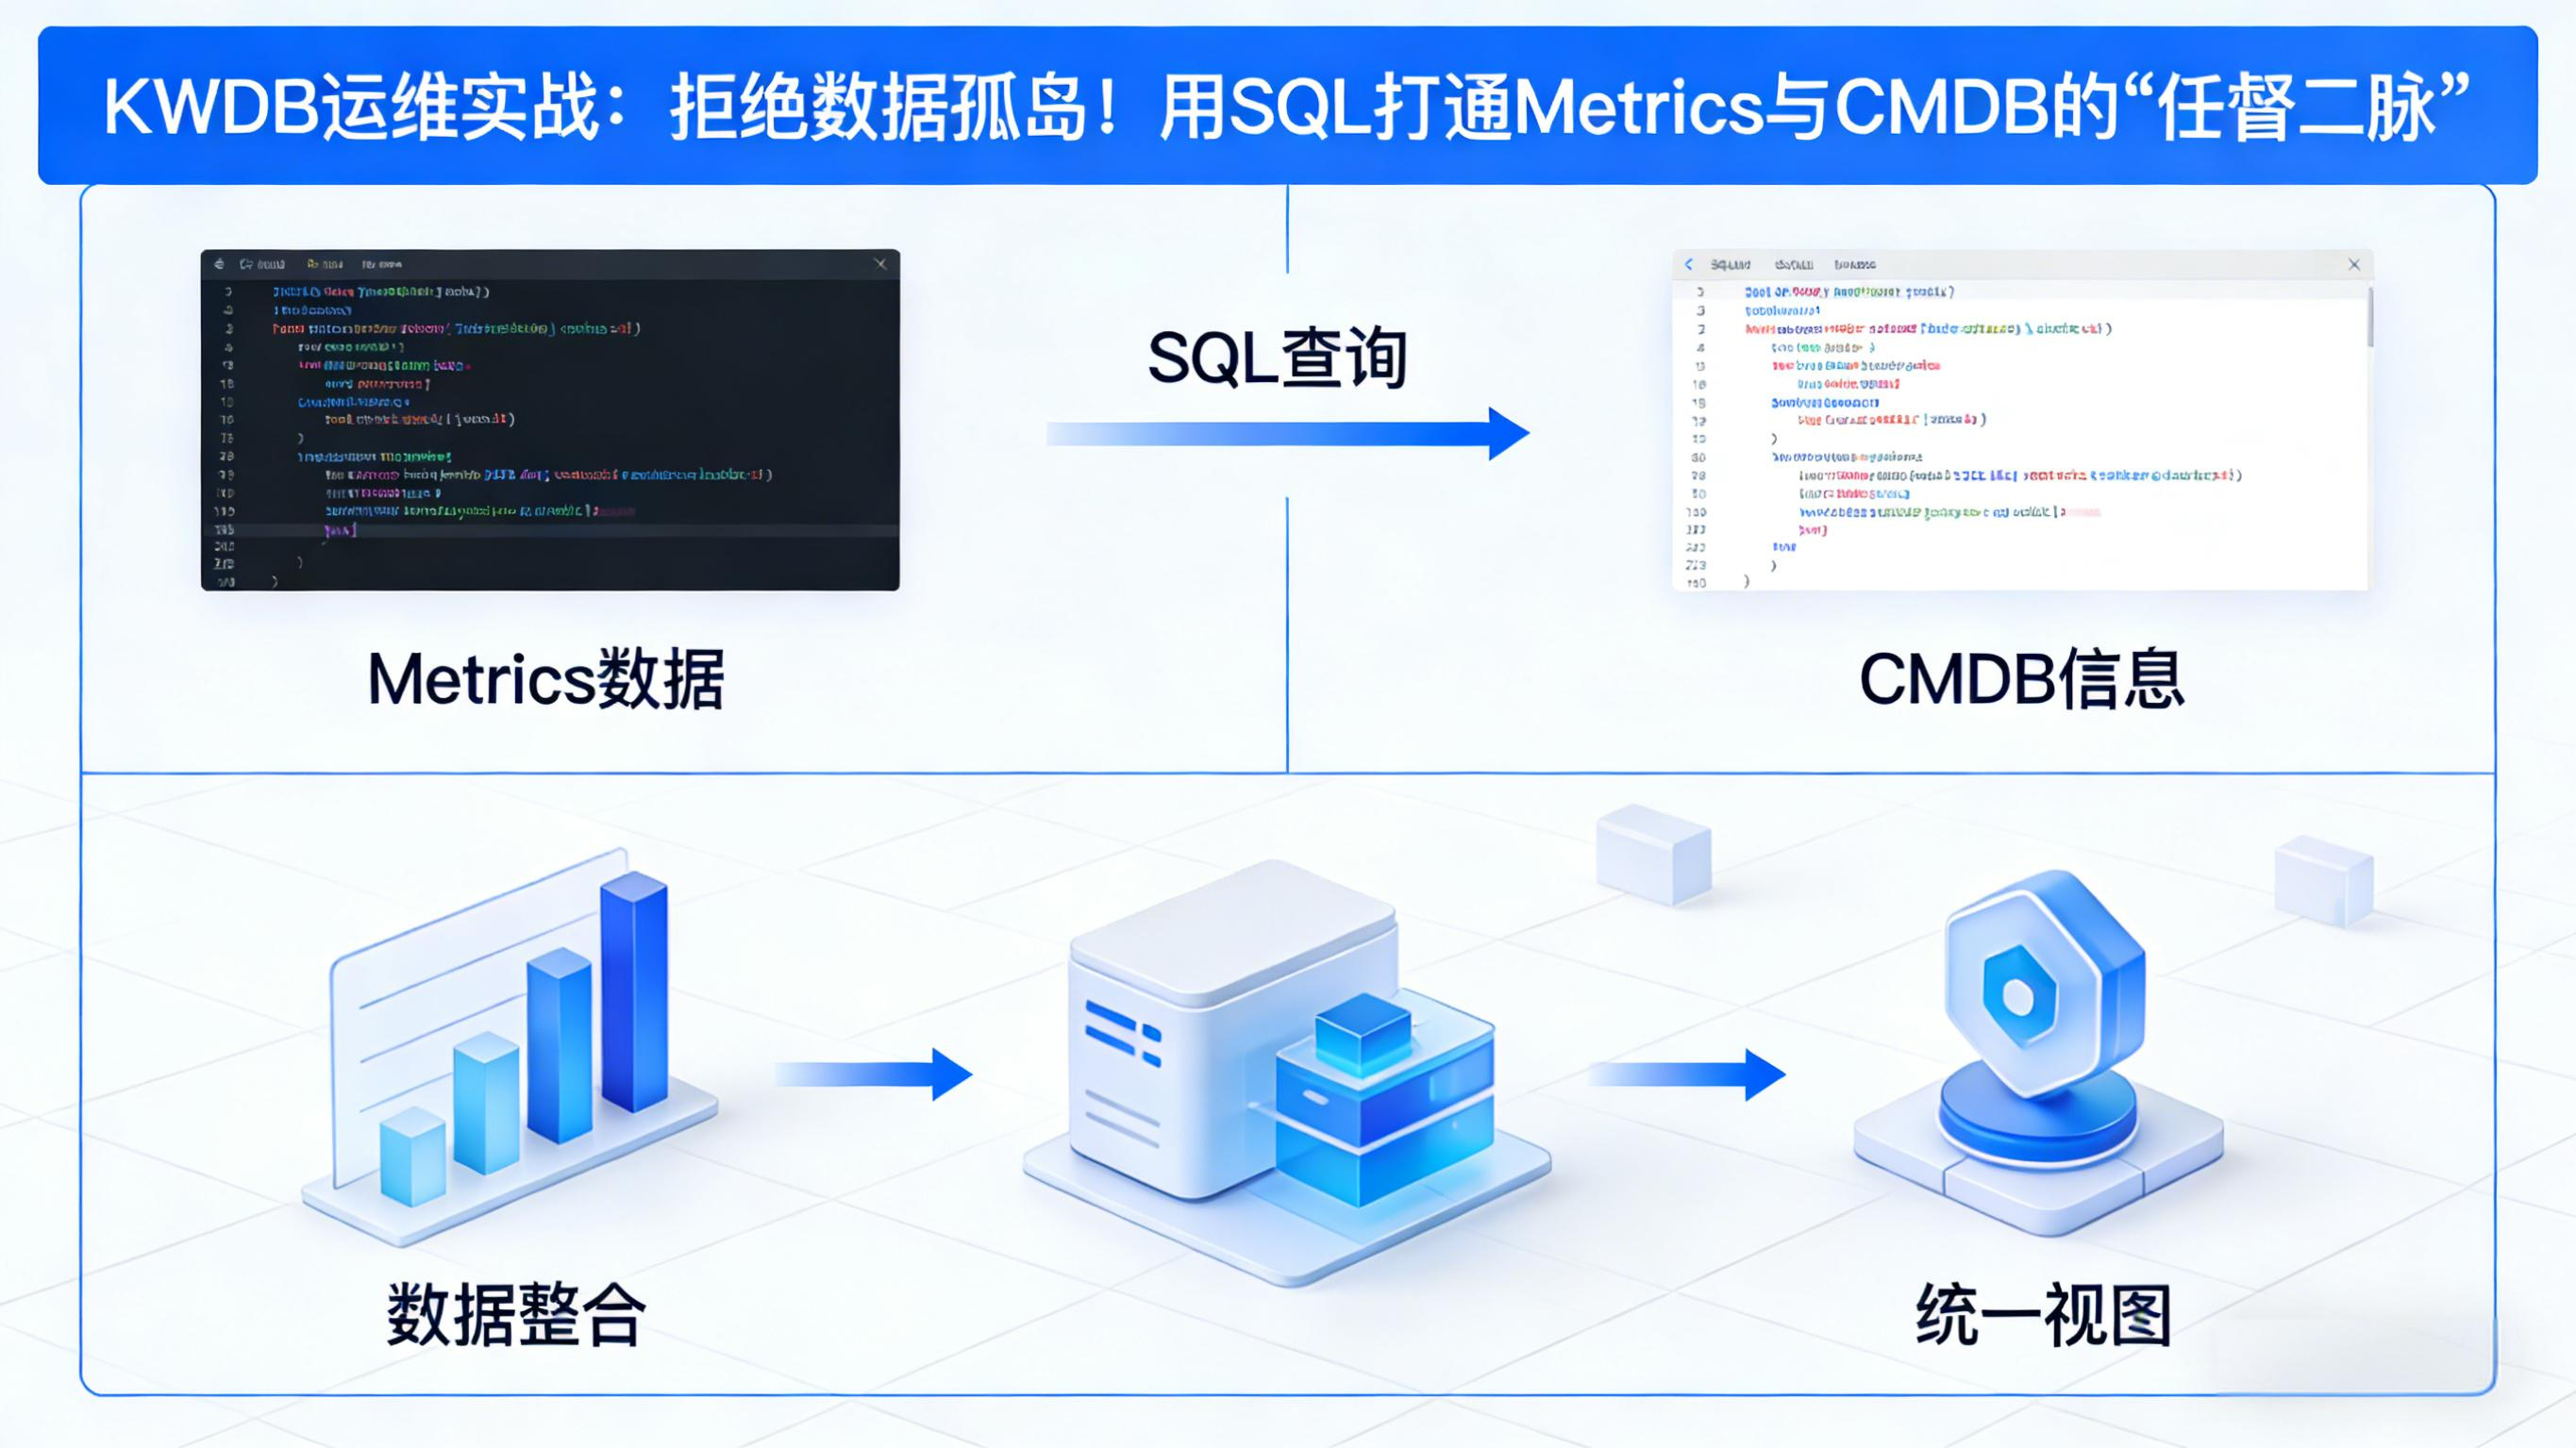
运维人员真正需要的是:既能像 Prometheus 一样吞吐海量时序数据,又能像 MySQL 一样用标准 SQL 进行复杂关联查询。
本文将带你体验如何用 KWDB 3.1.0 搭建一个轻量级但高性能的 服务器监控系统,用一个数据库搞定“指标存储”与“资产管理”。
- 场景设定:
监控 500 台服务器的 CPU、内存、磁盘 IO 和网络流量。
- 核心挑战:
文章目录
-
- 1. 架构设计
-
- 1.1 监控链路图
- 2. 建模实战:指标体系
-
- 2.1 初始化环境
- 2.2 服务器资产表 (CMDB)
- 2.3 性能指标表 (Metrics)
- 3. 数据模拟:压测级脚本
- 4. 业务场景实战
-
- 场景一:P95 性能分析
- 场景二:机架级负载均衡 (Rack Traffic Analysis)
- 场景三:僵死服务器检测
- 5. 避坑指南
- 总结
1. 架构设计
1.1 监控链路图
#mermaid-svg-ju1HPsZZECjI53BR{font-family:\”trebuchet ms\”,verdana,arial,sans-serif;font-size:16px;fill:#333;}@keyframes edge-animation-frame{from{stroke-dashoffset:0;}}@keyframes dash{to{stroke-dashoffset:0;}}#mermaid-svg-ju1HPsZZECjI53BR .edge-animation-slow{stroke-dasharray:9,5!important;stroke-dashoffset:900;animation:dash 50s linear infinite;stroke-linecap:round;}#mermaid-svg-ju1HPsZZECjI53BR .edge-animation-fast{stroke-dasharray:9,5!important;stroke-dashoffset:900;animation:dash 20s linear infinite;stroke-linecap:round;}#mermaid-svg-ju1HPsZZECjI53BR .error-icon{fill:#552222;}#mermaid-svg-ju1HPsZZECjI53BR .error-text{fill:#552222;stroke:#552222;}#mermaid-svg-ju1HPsZZECjI53BR .edge-thickness-normal{stroke-width:1px;}#mermaid-svg-ju1HPsZZECjI53BR .edge-thickness-thick{stroke-width:3.5px;}#mermaid-svg-ju1HPsZZECjI53BR .edge-pattern-solid{stroke-dasharray:0;}#mermaid-svg-ju1HPsZZECjI53BR .edge-thickness-invisible{stroke-width:0;fill:none;}#mermaid-svg-ju1HPsZZECjI53BR .edge-pattern-dashed{stroke-dasharray:3;}#mermaid-svg-ju1HPsZZECjI53BR .edge-pattern-dotted{stroke-dasharray:2;}#mermaid-svg-ju1HPsZZECjI53BR .marker{fill:#333333;stroke:#333333;}#mermaid-svg-ju1HPsZZECjI53BR .marker.cross{stroke:#333333;}#mermaid-svg-ju1HPsZZECjI53BR svg{font-family:\”trebuchet ms\”,verdana,arial,sans-serif;font-size:16px;}#mermaid-svg-ju1HPsZZECjI53BR p{margin:0;}#mermaid-svg-ju1HPsZZECjI53BR .label{font-family:\”trebuchet ms\”,verdana,arial,sans-serif;color:#333;}#mermaid-svg-ju1HPsZZECjI53BR .cluster-label text{fill:#333;}#mermaid-svg-ju1HPsZZECjI53BR .cluster-label span{color:#333;}#mermaid-svg-ju1HPsZZECjI53BR .cluster-label span p{background-color:transparent;}#mermaid-svg-ju1HPsZZECjI53BR .label text,#mermaid-svg-ju1HPsZZECjI53BR span{fill:#333;color:#333;}#mermaid-svg-ju1HPsZZECjI53BR .node rect,#mermaid-svg-ju1HPsZZECjI53BR .node circle,#mermaid-svg-ju1HPsZZECjI53BR .node ellipse,#mermaid-svg-ju1HPsZZECjI53BR .node polygon,#mermaid-svg-ju1HPsZZECjI53BR .node path{fill:#ECECFF;stroke:#9370DB;stroke-width:1px;}#mermaid-svg-ju1HPsZZECjI53BR .rough-node .label text,#mermaid-svg-ju1HPsZZECjI53BR .node .label text,#mermaid-svg-ju1HPsZZECjI53BR .image-shape .label,#mermaid-svg-ju1HPsZZECjI53BR .icon-shape .label{text-anchor:middle;}#mermaid-svg-ju1HPsZZECjI53BR .node .katex path{fill:#000;stroke:#000;stroke-width:1px;}#mermaid-svg-ju1HPsZZECjI53BR .rough-node .label,#mermaid-svg-ju1HPsZZECjI53BR .node .label,#mermaid-svg-ju1HPsZZECjI53BR .image-shape .label,#mermaid-svg-ju1HPsZZECjI53BR .icon-shape .label{text-align:center;}#mermaid-svg-ju1HPsZZECjI53BR .node.clickable{cursor:pointer;}#mermaid-svg-ju1HPsZZECjI53BR .root .anchor path{fill:#333333!important;stroke-width:0;stroke:#333333;}#mermaid-svg-ju1HPsZZECjI53BR .arrowheadPath{fill:#333333;}#mermaid-svg-ju1HPsZZECjI53BR .edgePath .path{stroke:#333333;stroke-width:2.0px;}#mermaid-svg-ju1HPsZZECjI53BR .flowchart-link{stroke:#333333;fill:none;}#mermaid-svg-ju1HPsZZECjI53BR .edgeLabel{background-color:rgba(232,232,232, 0.8);text-align:center;}#mermaid-svg-ju1HPsZZECjI53BR .edgeLabel p{background-color:rgba(232,232,232, 0.8);}#mermaid-svg-ju1HPsZZECjI53BR .edgeLabel rect{opacity:0.5;background-color:rgba(232,232,232, 0.8);fill:rgba(232,232,232, 0.8);}#mermaid-svg-ju1HPsZZECjI53BR .labelBkg{background-color:rgba(232, 232, 232, 0.5);}#mermaid-svg-ju1HPsZZECjI53BR .cluster rect{fill:#ffffde;stroke:#aaaa33;stroke-width:1px;}#mermaid-svg-ju1HPsZZECjI53BR .cluster text{fill:#333;}#mermaid-svg-ju1HPsZZECjI53BR .cluster span{color:#333;}#mermaid-svg-ju1HPsZZECjI53BR div.mermaidTooltip{position:absolute;text-align:center;max-width:200px;padding:2px;font-family:\”trebuchet ms\”,verdana,arial,sans-serif;font-size:12px;background:hsl(80, 100%, 96.2745098039%);border:1px solid #aaaa33;border-radius:2px;pointer-events:none;z-index:100;}#mermaid-svg-ju1HPsZZECjI53BR .flowchartTitleText{text-anchor:middle;font-size:18px;fill:#333;}#mermaid-svg-ju1HPsZZECjI53BR rect.text{fill:none;stroke-width:0;}#mermaid-svg-ju1HPsZZECjI53BR .icon-shape,#mermaid-svg-ju1HPsZZECjI53BR .image-shape{background-color:rgba(232,232,232, 0.8);text-align:center;}#mermaid-svg-ju1HPsZZECjI53BR .icon-shape p,#mermaid-svg-ju1HPsZZECjI53BR .image-shape p{background-color:rgba(232,232,232, 0.8);padding:2px;}#mermaid-svg-ju1HPsZZECjI53BR .icon-shape rect,#mermaid-svg-ju1HPsZZECjI53BR .image-shape rect{opacity:0.5;background-color:rgba(232,232,232, 0.8);fill:rgba(232,232,232, 0.8);}#mermaid-svg-ju1HPsZZECjI53BR .label-icon{display:inline-block;height:1em;overflow:visible;vertical-align:-0.125em;}#mermaid-svg-ju1HPsZZECjI53BR .node .label-icon path{fill:currentColor;stroke:revert;stroke-width:revert;}#mermaid-svg-ju1HPsZZECjI53BR :root{–mermaid-font-family:\”trebuchet ms\”,verdana,arial,sans-serif;}
HTTP
Batch Insert
SQL Query
SQL Alert
服务器 Agent – Telegraf
数据接收服务
KWDB 集群
Grafana 监控面板
报警中心
2. 建模实战:指标体系
一个优秀的监控系统,必须能打通“固定资产”与“动态指标”。
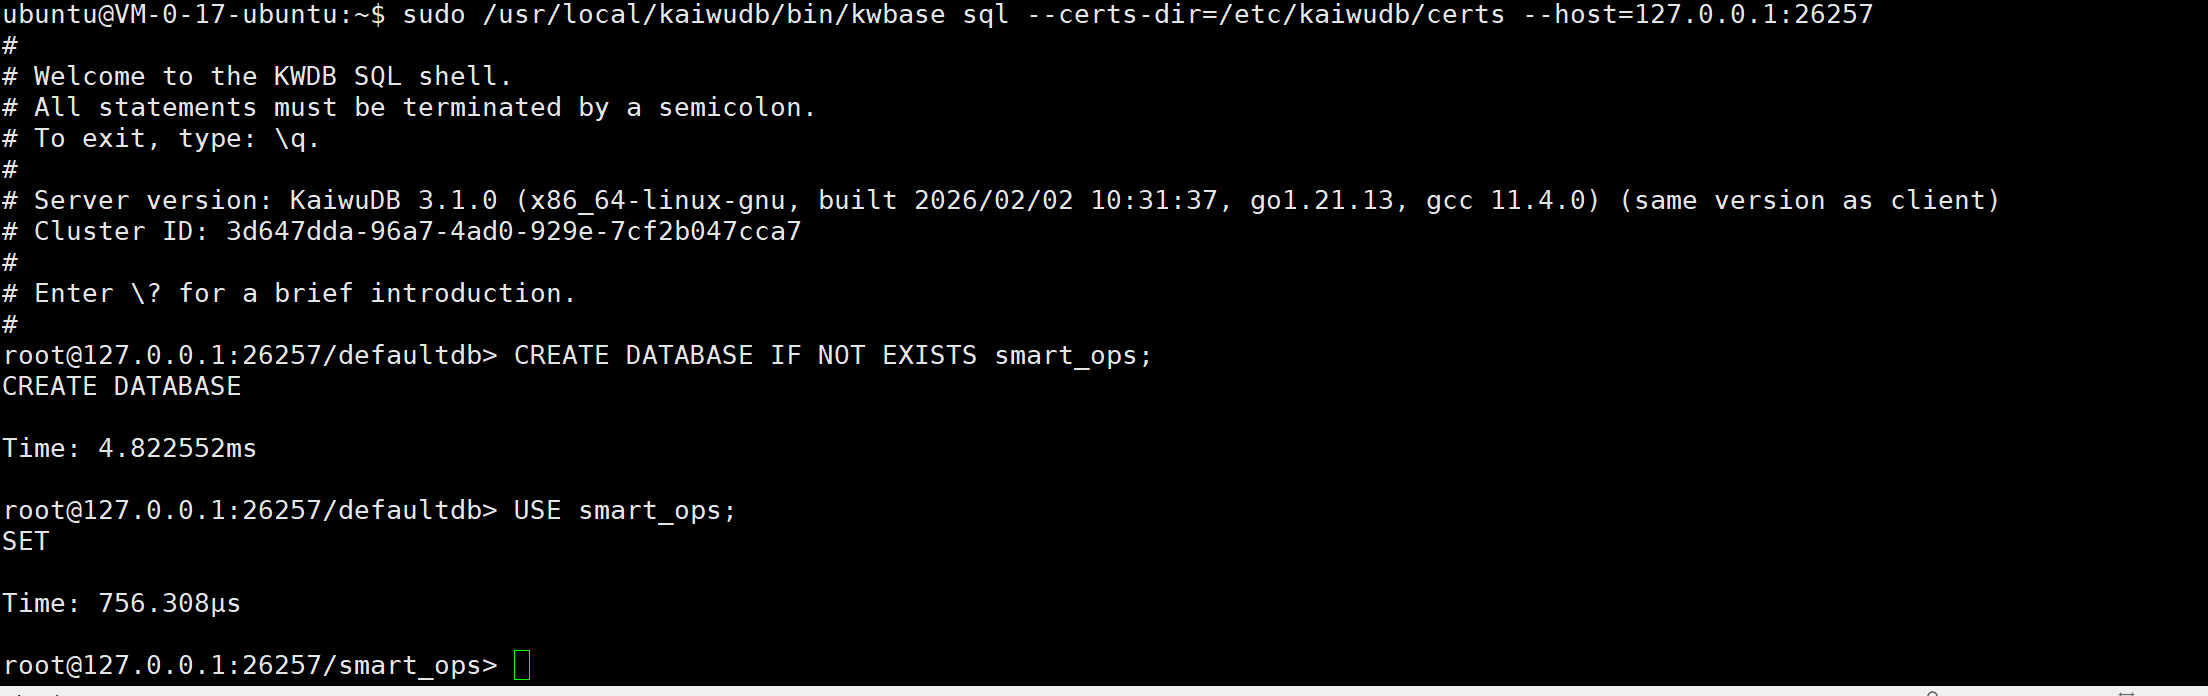
2.1 初始化环境
sudo /usr/local/kaiwudb/bin/kwbase sql \\
–certs-dir=/etc/kaiwudb/certs \\
–host=127.0.0.1:26257
CREATE DATABASE IF NOT EXISTS smart_ops;
USE smart_ops;
2.2 服务器资产表 (CMDB)
这是典型的关系型数据,存储服务器的静态属性。 思考:为什么不把这些信息直接写在时序表里? 因为 rack_id(机架)、os_version(操作系统)等信息是所有指标共享的维度。将它们独立存储,既能节省存储空间(无需在每条指标数据中重复记录),又能支持灵活的维度变更(例如服务器迁移机架,只需改一张表)。
CREATE TABLE servers (
hostname VARCHAR(50) PRIMARY KEY, — 主机名 (唯一)
ip_address VARCHAR(20), — IP地址
rack_id VARCHAR(20), — 机架编号
os_version VARCHAR(50), — 操作系统
cpu_cores INT, — CPU核数
mem_gb INT — 内存大小
);
— 模拟资产数据
INSERT INTO servers VALUES
('web-01', '192.168.1.101', 'Rack-A01', 'Ubuntu 22.04', 16, 32),
('web-02', '192.168.1.102', 'Rack-A01', 'Ubuntu 22.04', 16, 32),
('db-01', '192.168.1.201', 'Rack-B02', 'CentOS 7.9', 32, 128),
('db-02', '192.168.1.202', 'Rack-B02', 'CentOS 7.9', 32, 128);

2.3 性能指标表 (Metrics)
Tag 设计:hostname 是核心维度,它是连接 CMDB 表和 Metrics 表的纽带。
CREATE TABLE server_metrics (
ts TIMESTAMP NOT NULL, — 时间戳
hostname VARCHAR(50) NOT NULL, — 主机名 (Tag)
cpu_usage DOUBLE, — CPU使用率 (%)
mem_usage DOUBLE, — 内存使用率 (%)
disk_io_read DOUBLE, — 磁盘读 (MB/s)
disk_io_write DOUBLE, — 磁盘写 (MB/s)
net_in DOUBLE, — 网络入 (Mbps)
net_out DOUBLE, — 网络出 (Mbps)
PRIMARY KEY (ts, hostname)
);
3. 数据模拟:压测级脚本
脚本 gen_ops_data.py 模拟 4 台服务器过去 6 小时的数据。
import random
from datetime import datetime, timedelta
# 配置
FILENAME = "ops_data.sql"
HOSTS = ['web-01', 'web-02', 'db-01', 'db-02']
START_TIME = datetime.now() – timedelta(hours=6)
INTERVAL_SECONDS = 5 # 5秒一个点
TOTAL_POINTS = int(6 * 3600 / INTERVAL_SECONDS)
print(f"正在生成 {len(HOSTS)} 台服务器,过去 6 小时的监控数据…")
with open(FILENAME, "w") as f:
f.write("USE smart_ops;\\n")
f.write("INSERT INTO server_metrics (ts, hostname, cpu_usage, mem_usage, disk_io_read, disk_io_write, net_in, net_out) VALUES\\n")
records = []
for host in HOSTS:
# 模拟不同角色的负载特征
base_cpu = 20 if 'web' in host else 40
base_mem = 40 if 'web' in host else 70
for i in range(TOTAL_POINTS):
ts = (START_TIME + timedelta(seconds=i*INTERVAL_SECONDS)).strftime('%Y-%m-%d %H:%M:%S')
# 波动
cpu = base_cpu + random.uniform(–10, 30)
if cpu > 100: cpu = 100
mem = base_mem + random.uniform(–5, 10)
if mem > 100: mem = 100
disk_r = random.uniform(0, 100)
disk_w = random.uniform(0, 50)
# 数据库服务器 IO 更高
if 'db' in host:
disk_r *= 2
disk_w *= 3
net_in = random.uniform(10, 1000)
net_out = random.uniform(10, 1000)
records.append(f"('{ts}', '{host}', {round(cpu,1)}, {round(mem,1)}, {round(disk_r,1)}, {round(disk_w,1)}, {round(net_in,1)}, {round(net_out,1)})")
# 批量写入
batch_size = 1000
total = len(records)
for i, record in enumerate(records):
if (i + 1) % batch_size == 0 or i == total – 1:
f.write(f"{record};\\n")
if i < total – 1:
f.write("INSERT INTO server_metrics (ts, hostname, cpu_usage, mem_usage, disk_io_read, disk_io_write, net_in, net_out) VALUES\\n")
else:
f.write(f"{record},\\n")
print(f"生成完毕!总记录数: {total}")
print(f"请运行: time sudo /usr/local/kaiwudb/bin/kwbase sql –certs-dir=/etc/kaiwudb/certs –host=127.0.0.1:26257 < {FILENAME}")
执行导入:
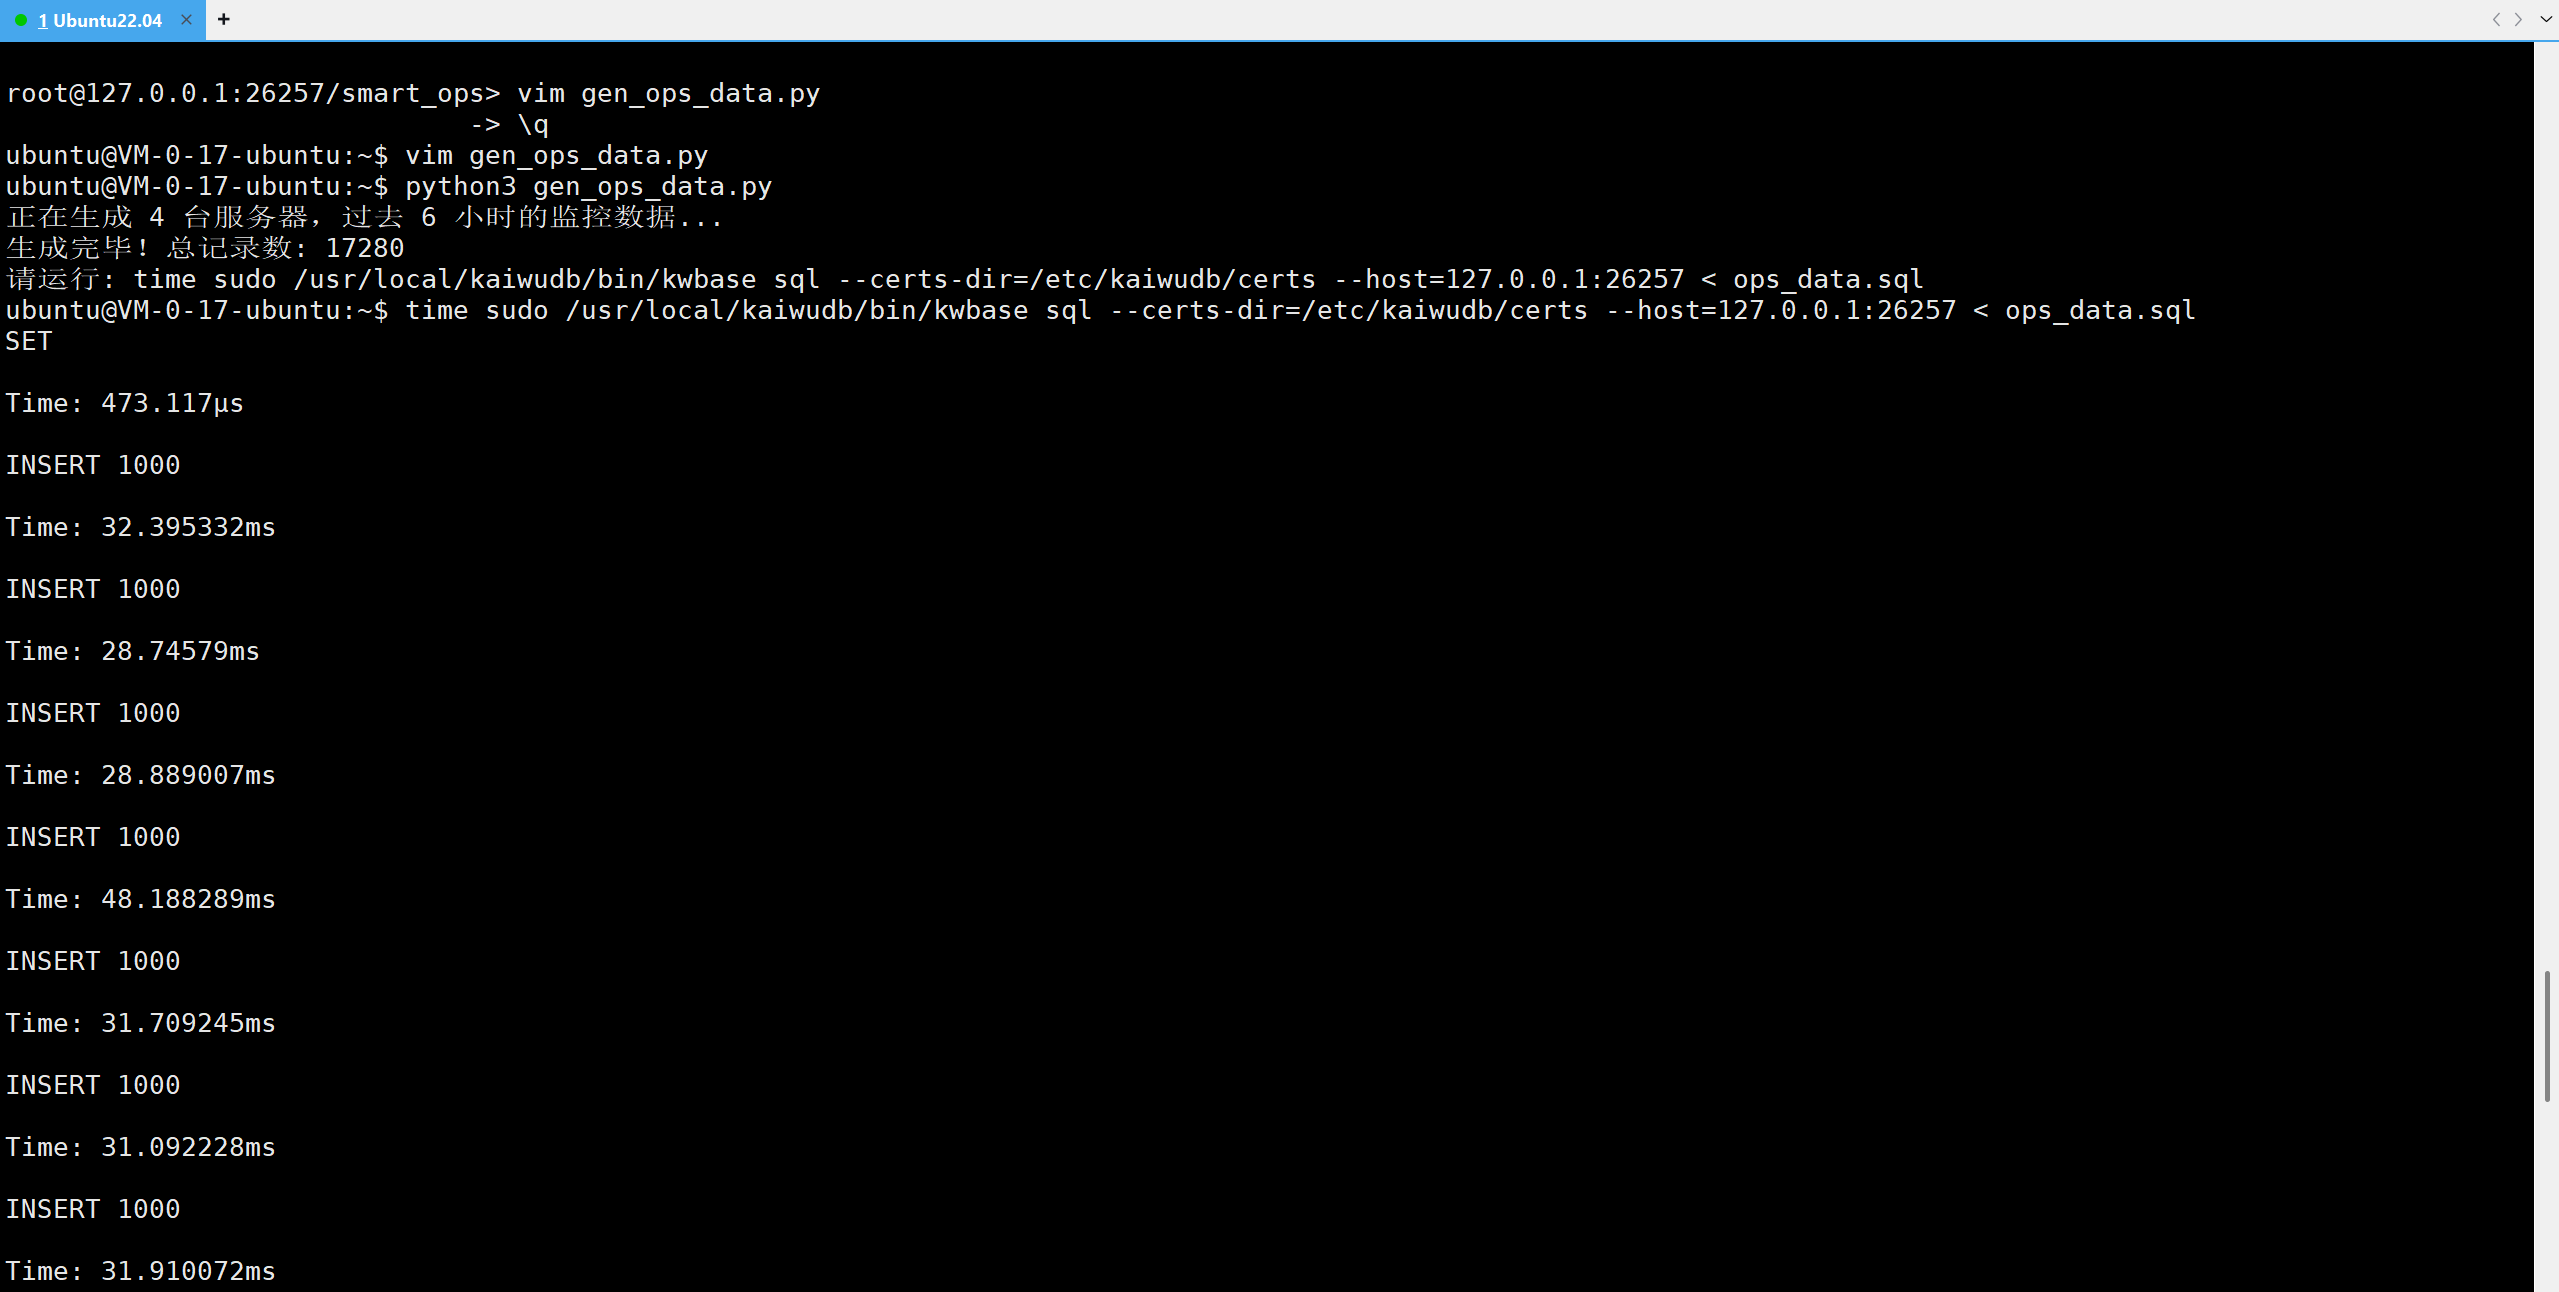
python3 gen_ops_data.py
time sudo /usr/local/kaiwudb/bin/kwbase sql –certs-dir=/etc/kaiwudb/certs –host=127.0.0.1:26257 < ops_data.sql
执行结果分析:
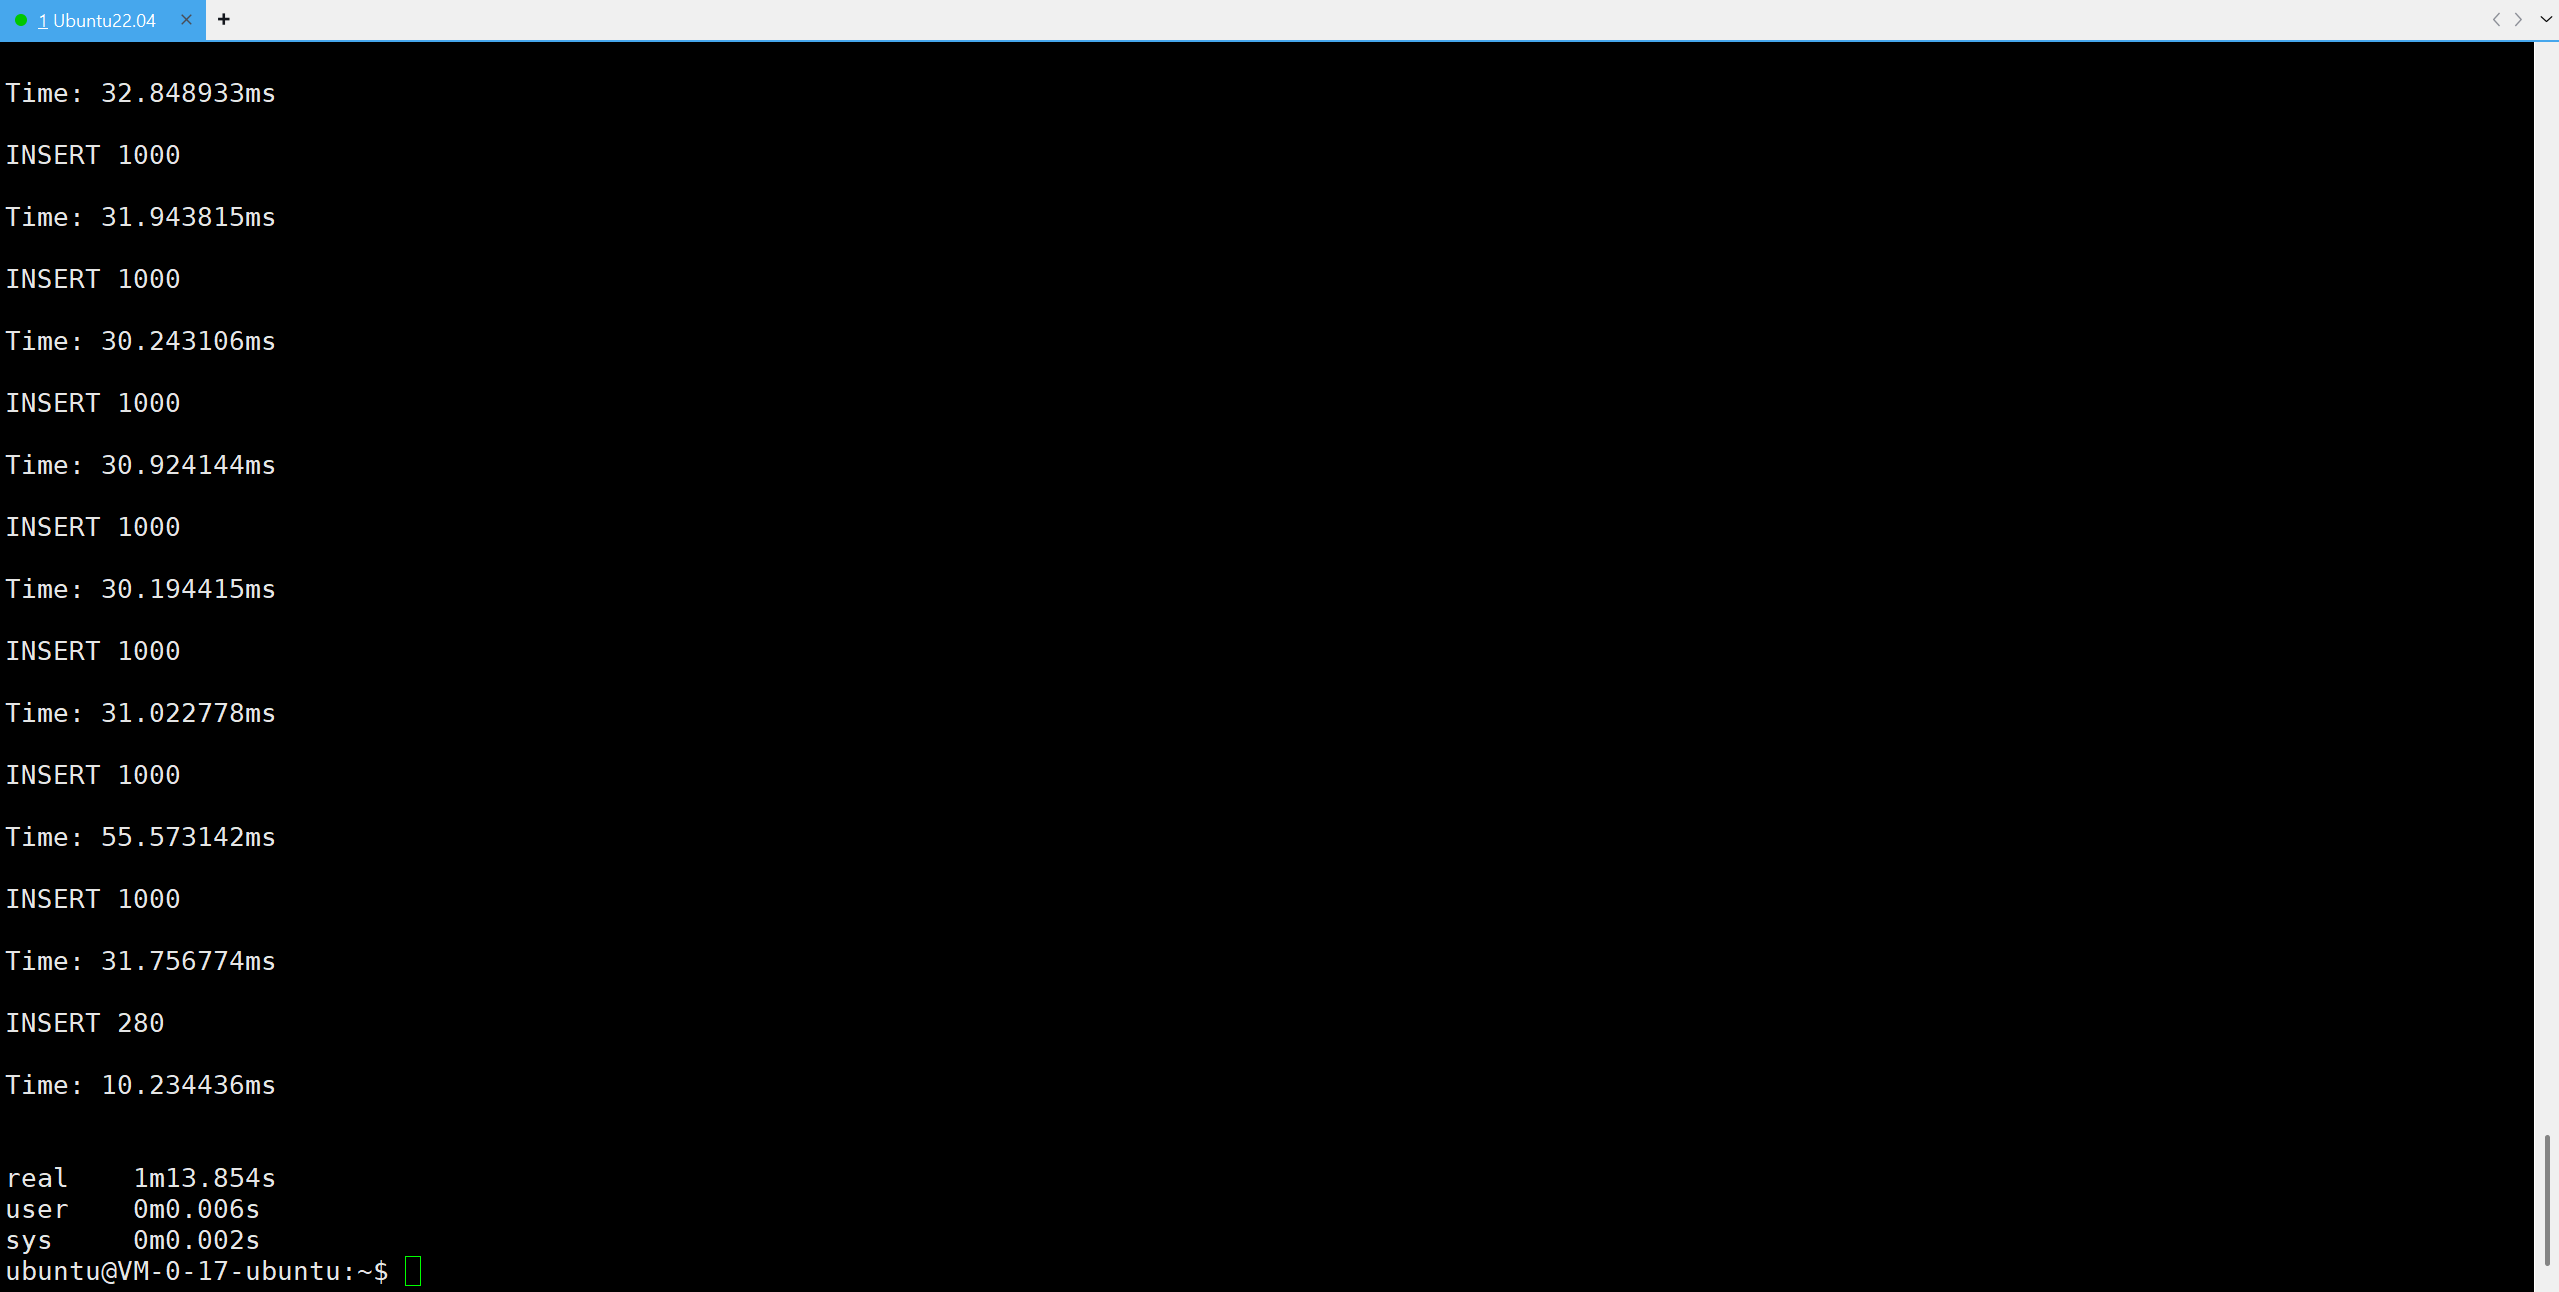
- 写入性能:从图 中可以看到,每一批 1000 条数据的写入时间稳定在 30ms 左右。这意味着在单线程情况下,KWDB 的写入吞吐量轻松达到 3.3万 TPS。对于 500 台服务器每 5 秒上报一次(即 100 TPS)的场景,KWDB 仅用极小的系统资源就能轻松扛住。
- 稳定性:整个导入过程耗时约 1分13秒,写入了 17280 条记录(模拟数据量),全程无报错,验证了 Batch Insert 方案的健壮性。
4. 业务场景实战
注意:执行前请确保 USE smart_ops;。
场景一:P95 性能分析
需求:计算每台服务器在过去 1 小时内的 P95 CPU 使用率(即 95% 的时间 CPU 都低于这个值),这是容量规划的重要依据。
USE smart_ops;
— 简单的平均值可能掩盖毛刺,P95 更能反映真实压力
— 注意:如果当前版本暂不支持 percentile_cont,可以使用 avg/max 替代
SELECT
hostname,
avg(cpu_usage) as avg_cpu,
max(cpu_usage) as max_cpu
FROM server_metrics
WHERE ts > now() – interval '1 hour'
GROUP BY hostname;
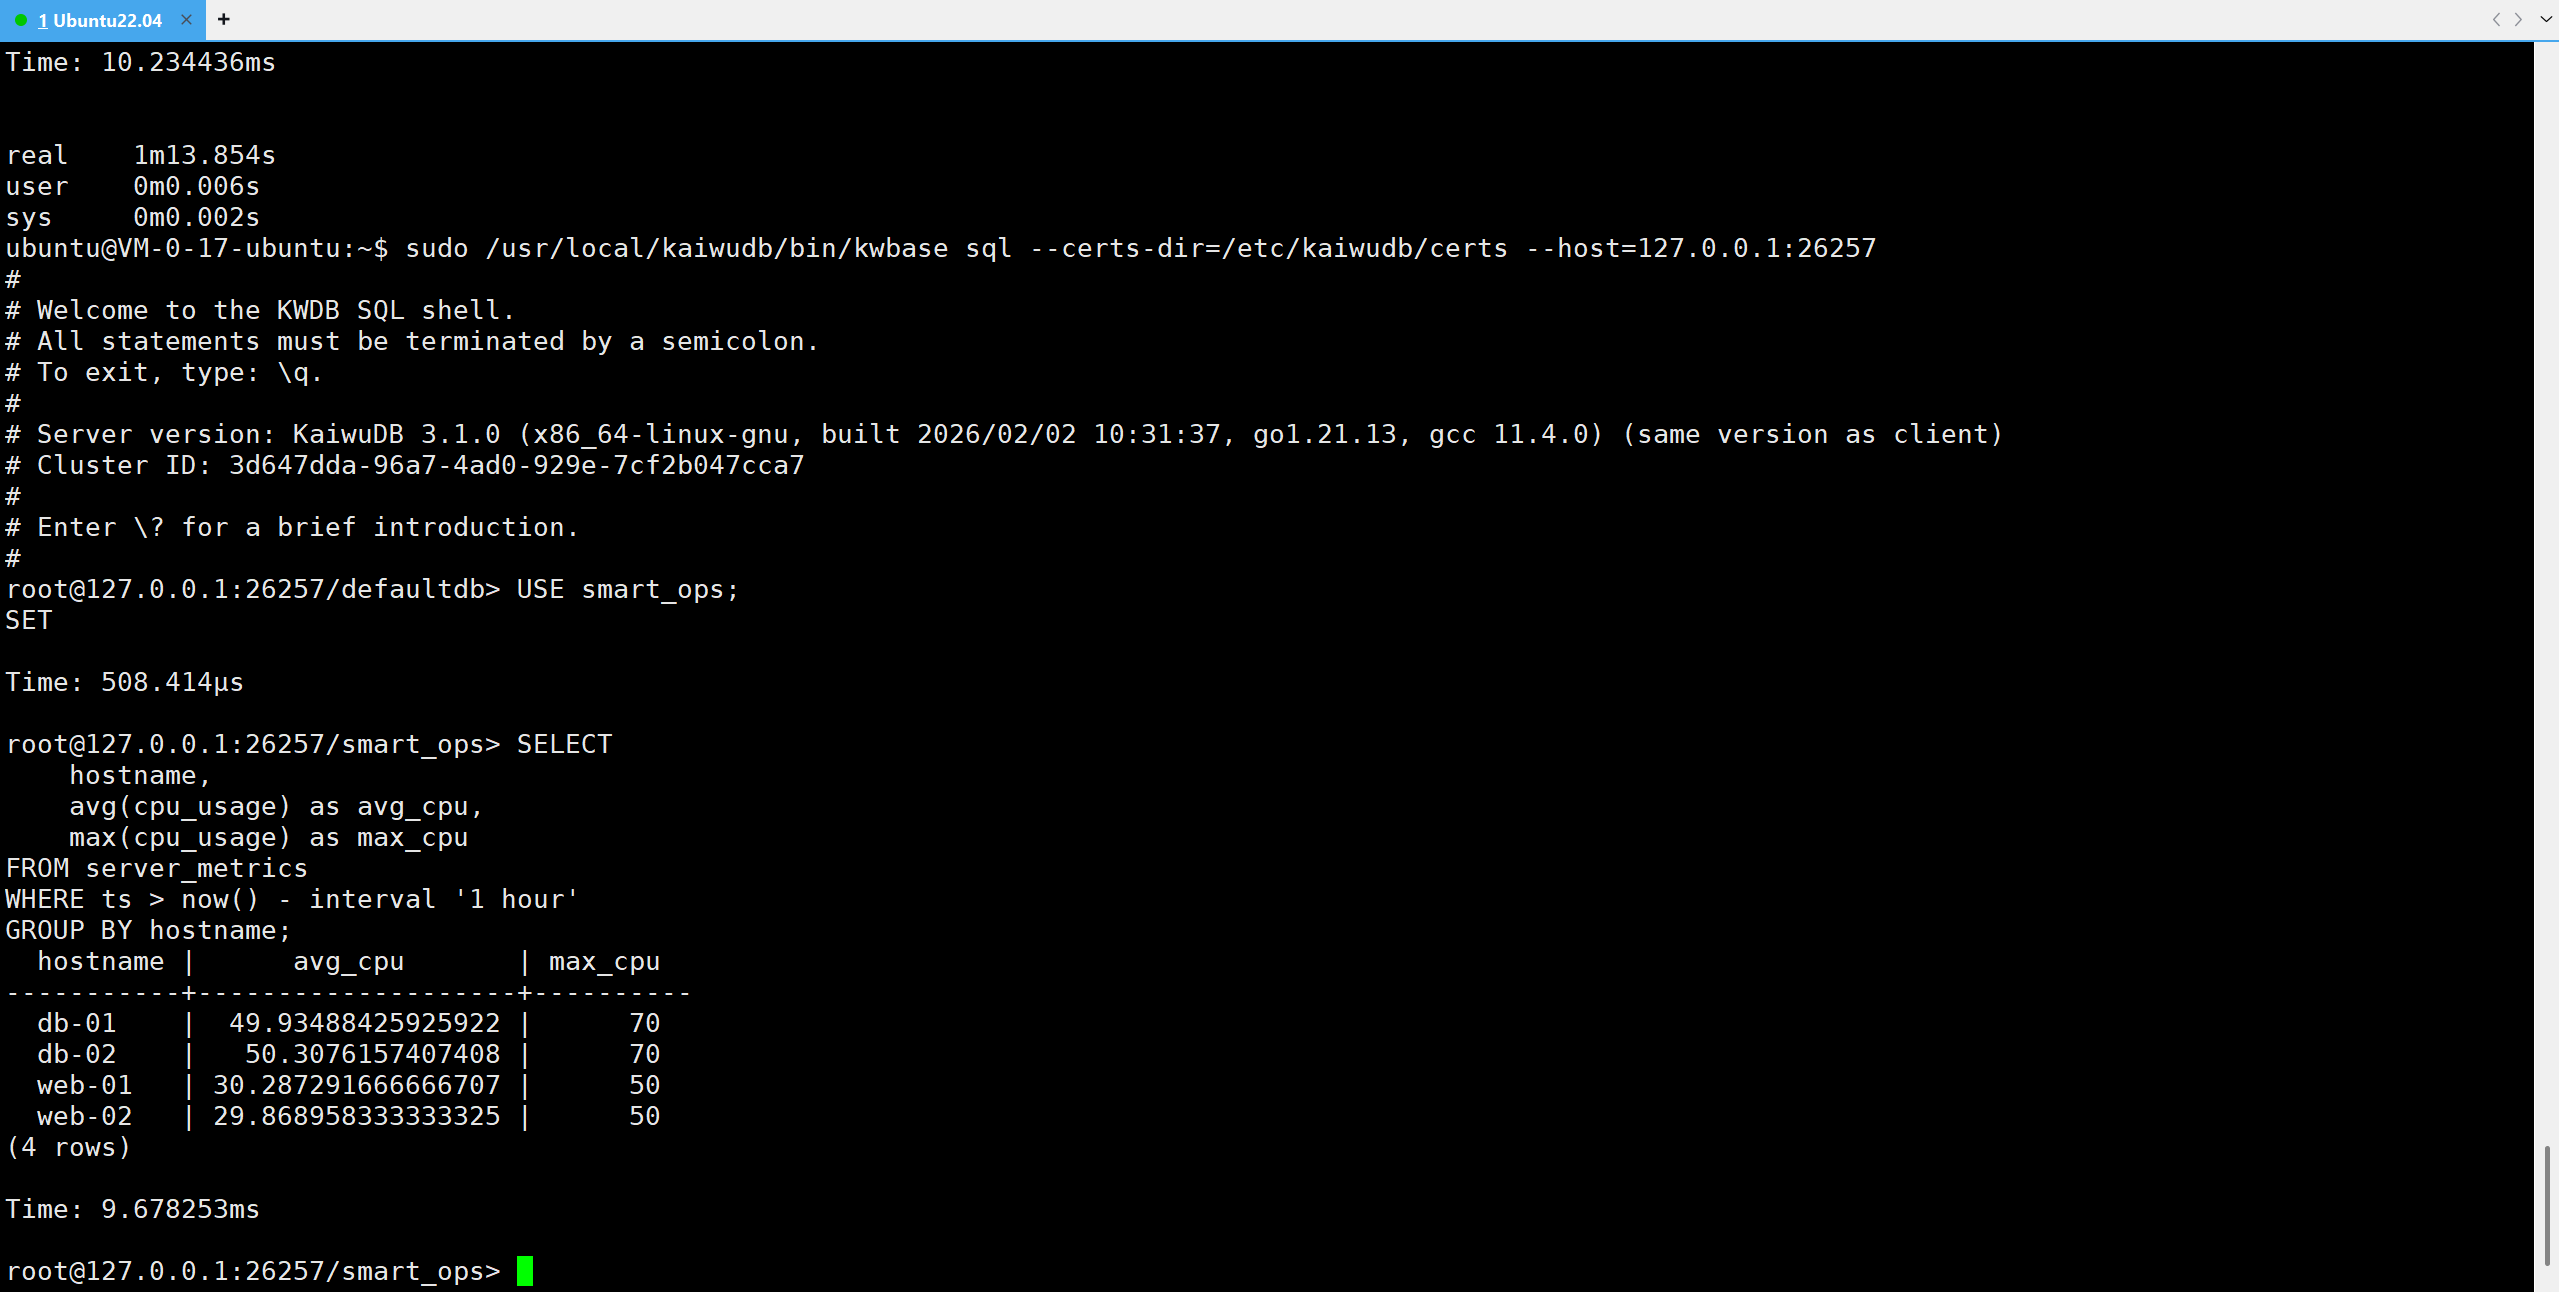
执行结果分析:
- 查询效率:查询耗时仅 9.68ms。
- 数据洞察:结果清晰展示了不同角色的服务器负载特征。db-01 和 db-02 的 CPU 使用率都在 50% 左右(Max 70%),符合数据库服务器的高负载特征;而 web-01 和 web-02 则在 30% 左右。P95 分析(这里用 Max 近似)帮助我们快速识别出了系统的潜在瓶颈在 DB 层。
场景二:机架级负载均衡 (Rack Traffic Analysis)
业务痛点:数据中心的交换机带宽是有限的。如果某个机架上的服务器流量总和过大,会打爆接入交换机,导致整个机架网络瘫痪。这需要我们将“时序数据”与“CMDB 资产数据”关联分析。
需求:统计每个机架(Rack)的总带宽使用量,防止机架交换机打爆。
USE smart_ops;
SELECT
s.rack_id,
sum(m.net_in) as total_net_in,
sum(m.net_out) as total_net_out
FROM server_metrics m
JOIN servers s ON m.hostname = s.hostname
WHERE m.ts > now() – interval '5 minute' — 实时流量
GROUP BY s.rack_id;
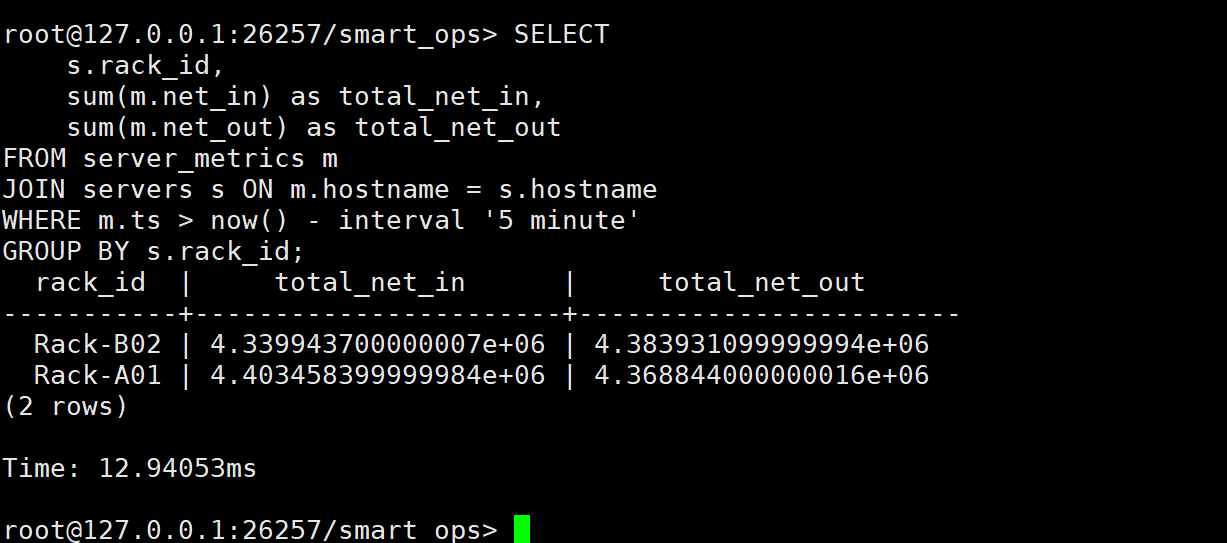
执行结果分析:
- 多维聚合:耗时 12.94ms。
- 业务价值:这是一个典型的跨表聚合查询。KWDB 成功将 Metrics 表中的流量数据与 CMDB 表中的机架信息(Rack-A01, Rack-B02)进行了关联。结果显示两个机架的流量负载非常均衡(都在 4.4M 左右),说明当前的负载均衡策略是有效的。如果某个机架流量突增,这个查询能立竿见影地发现问题。
场景三:僵死服务器检测
需求:找出最近 5 分钟没有上报数据的服务器(可能是宕机了)。
USE smart_ops;
SELECT
s.hostname,
s.ip_address,
max(m.ts) as last_heartbeat
FROM servers s
LEFT JOIN server_metrics m ON s.hostname = m.hostname
GROUP BY s.hostname, s.ip_address
HAVING max(m.ts) < now() – interval '5 minute' OR max(m.ts) IS NULL;
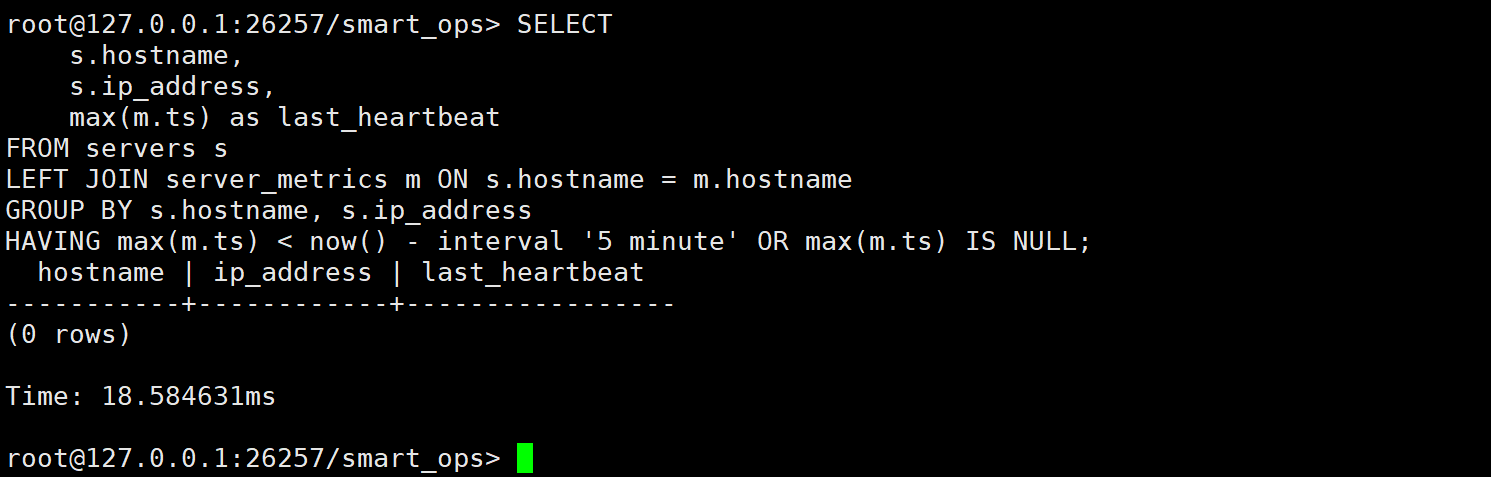
执行结果分析:
- 检测结果:查询耗时 18.58ms,返回 0 rows。
- 含义解读:这说明当前所有在册的服务器(CMDB 中登记的)在过去 5 分钟内都有正常的心跳上报,系统处于极其健康的状态。这种“反向查询”(找缺失的数据)是时序数据库中较难处理的场景,而 KWDB 凭借标准的 SQL 能力(LEFT JOIN + HAVING)轻松搞定。
5. 避坑指南
总结
KWDB 在运维监控场景下表现出色,单机即可支撑数千台服务器的指标写入。相比 Prometheus,它最大的优势在于支持标准 SQL,这让运维人员可以非常灵活地进行多维关联分析。
核心价值回顾:
随着 AIOps 的发展,基于 KWDB 我们还能做更多:
- 异常检测:利用 KWDB 的分析函数,计算 CPU 使用率的同比/环比变化,自动发现“异常突增”。
- 根因分析:当 Web 服务器响应变慢时,通过 SQL 关联查询同一时刻数据库服务器的负载,快速定位是应用层问题还是数据库层问题。
- 日志分析:虽然本文主要讲指标,但 KWDB 同样可以存储结构化的日志数据,实现“指标+日志”的统一检索。
通过构建统一的运维数据底座,我们不再是“救火队员”,而是系统的“健康管理师”。

