【从0开始学OpenCV】01.图像的基本操作 二
04. 用 matplotlib 显示图像(plt.imshow)
1) 函数说明
在 notebook/图窗中显示图像,适合排版对比。
2) 常用原型
plt.imshow(X, cmap=None, vmin=None, vmax=None, interpolation=None, alpha=None)
3) 参数说明(常用)
-
X: np.ndarray
-
灰度:H×W
-
彩色:H×W×3(RGB,不是 BGR)
-
-
cmap
-
灰度推荐 cmap="gray"
-
-
vmin/vmax
-
控制显示强度范围(对 16bit/浮点图很有用)
-
-
interpolation
-
"nearest" 看像素细节;"bilinear" 更平滑
-
-
alpha
-
透明度 0–1
-
4) 返回值
AxesImage(通常不接)
5) 注意事项
-
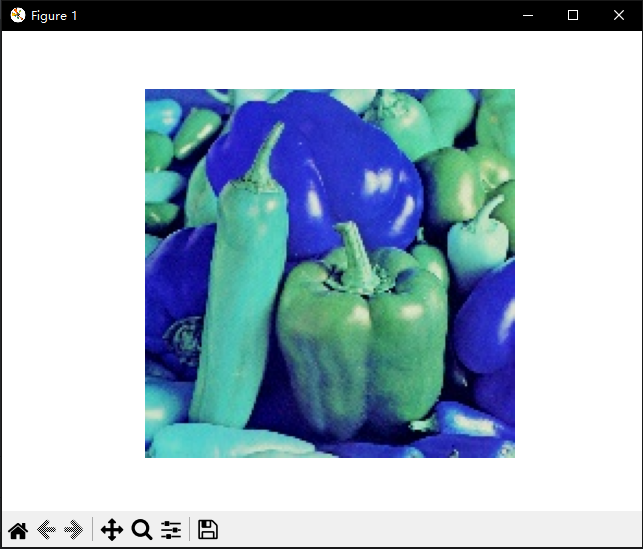
OpenCV 读入彩色是 BGR,显示前要转 RGB。
6) 基本例程
import cv2
import matplotlib.pyplot as plt
# 原图
img_bgr = cv2.imread("test_img_v.png")
cv2.imshow("test_img_v", img_bgr)
cv2.waitKey(0)
cv2.destroyAllWindows()
#未改变成RGB
plt.imshow(img_bgr)
plt.axis("off")
plt.show()
#转换成RGB
img_rgb = cv2.cvtColor(img_bgr, cv2.COLOR_RGB2BGR)
plt.imshow(img_rgb)
plt.axis("off")
plt.show()

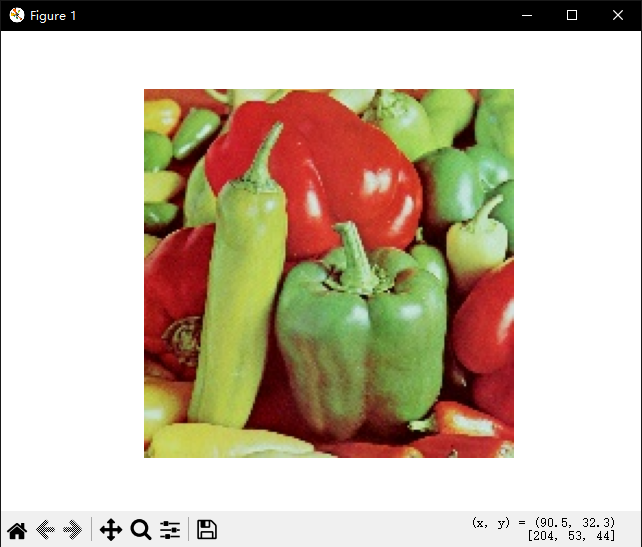
7) 拓展例程:并排对比(原图 vs 灰度)
import cv2
import matplotlib.pyplot as plt
img_bgr = cv2.imread("test_img_v.png")
img_rgb = cv2.cvtColor(img_bgr, cv2.COLOR_RGB2BGR)
img_gray = cv2.cvtColor(img_bgr, cv2.COLOR_BGR2GRAY)
plt.figure(figsize=(10,4))
plt.subplot(1,2,1); plt.imshow(img_rgb); plt.title("RGB"); plt.axis("off")
plt.subplot(1,2,2); plt.imshow(img_gray, cmap = "gray"); plt.title("Gray"); plt.axis("off")
plt.show()

05. 图像的属性(np.shape / dtype 等)
1) 说明
OpenCV 图像就是 numpy.ndarray,常用属性用于理解尺寸、通道、类型。
2) 常用属性(无参数)
-
img.shape
-
彩色:(H, W, 3);灰度:(H, W)
-
-
img.dtype
-
常见 uint8
-
-
img.ndim
-
2(灰度)/ 3(彩色)
-
-
img.size
-
元素总数 = H×W×C
-
3) 基本例程
import cv2
img = cv2.imread("test_img_v.png")
print("shape:", img.shape)
print("dtype:", img.dtype)
print("ndim :", img.ndim)
print("size :", img.size)
print("min/max:", img.min(), img.max())
输出:
shape: (170, 170, 3)
dtype: uint8
ndim : 3
size : 86700
min/max: 0 255
进程已结束,退出代码为 0
4) 拓展例程:统一拿到 H/W/C(灰度也兼容)
import cv2
img = cv2.imread("test_img_v.png", cv2.IMREAD_UNCHANGED)
gray = cv2.cvtColor(img, cv2.COLOR_BGR2GRAY)
h ,w = img.shape[:2]
c = img.shape[2] if img.ndim == 3 else 1
h_g, w_g = gray.shape[:2]
c_g = gray.shape[2] if gray.ndim == 3 else 1
print(f"RGB: H={h},W={w},C={c},dtype={img.dtype}")
print(f"GRAY: H={h_g},W={w_g},C={c_g},dtype={gray.dtype}")
输出结果:
RGB: H=170,W=170,C=3,dtype=uint8
GRAY: H=170,W=170,C=1,dtype=uint8
进程已结束,退出代码为 0
06. 像素的编辑(img.itemset)
1) 函数说明
修改某个像素(或像素某通道)的值,原地修改。
2) 函数原型
img.itemset((i0, i1, …), value)
3) 参数说明
-
(i0, i1, …)
-
索引元组:
-
灰度:(y, x)
-
彩色:(y, x, c),c=0/1/2 表示 B/G/R
-
-
-
value
-
写入值(会按 dtype 规则截断)
-
4) 返回值
无(原地修改)
5) 注意事项
只适合少量点编辑;批量操作用切片更快:img[y, x, c] = v。
6) 基本例程
import cv2
import matplotlib.pyplot as plt
img = cv2.imread("test_img_v.png")
img_rgb = cv2.cvtColor(img, cv2.COLOR_BGR2RGB)
img_rgb.itemset((30,30,2),255)
plt.imshow(img_rgb); plt.title("RGB"); plt.axis("off")
plt.show()
7) 拓展例程:画一个“红点十字”(更直观看到修改效果)
import cv2
import matplotlib.pyplot as plt
img = cv2.imread("test_img_v.png")
img = cv2.cvtColor(img, cv2.COLOR_BGR2RGB)
y, x = 120,120
for dx in range(-20,21):
if 0 <= x+dx < img.shape[1]:
img.itemset((y, x+dx, 0), 255)
for dy in range(-20,21):
if 0 <= y+dy < img.shape[0]:
img.itemset((y+dy, x, 0), 255)
print(img.shape)
plt.imshow(img); plt.title("itemset"); plt.axis("off")
plt.show()