Python 性能透视:从 cProfile 到 py-spy,AI 工程师的代码加速工具箱
一、慢代码的玄学:为什么"感觉慢"不是优化依据
你写了一个数据处理脚本,跑了 3 个小时。你"感觉"是数据加载太慢,于是花了一天优化 IO,结果只快了 5%。真正的时间黑洞是那个嵌套循环里的字符串拼接——占了 60% 的运行时间,但你凭直觉根本猜不到。
性能优化的第一法则:先测量,再优化。没有数据的优化是玄学,有数据的优化是科学。Python 生态有丰富的性能分析工具,从标准库的 cProfile 到采样分析器 py-spy,从内存分析器 memory_profiler 到行级分析器 line_profiler。掌握这些工具,就像拥有了 X 光透视眼——代码的每一个瓶颈都无处遁形。
我养了一只英短猫叫 Tensor,它有时候动作慢吞吞的。我不能凭感觉判断它是懒还是病了——得用体温计、体重秤、活动量数据来判断。代码性能分析也是同样的道理。
二、Python 性能分析工具架构:从宏观到微观的四层分析
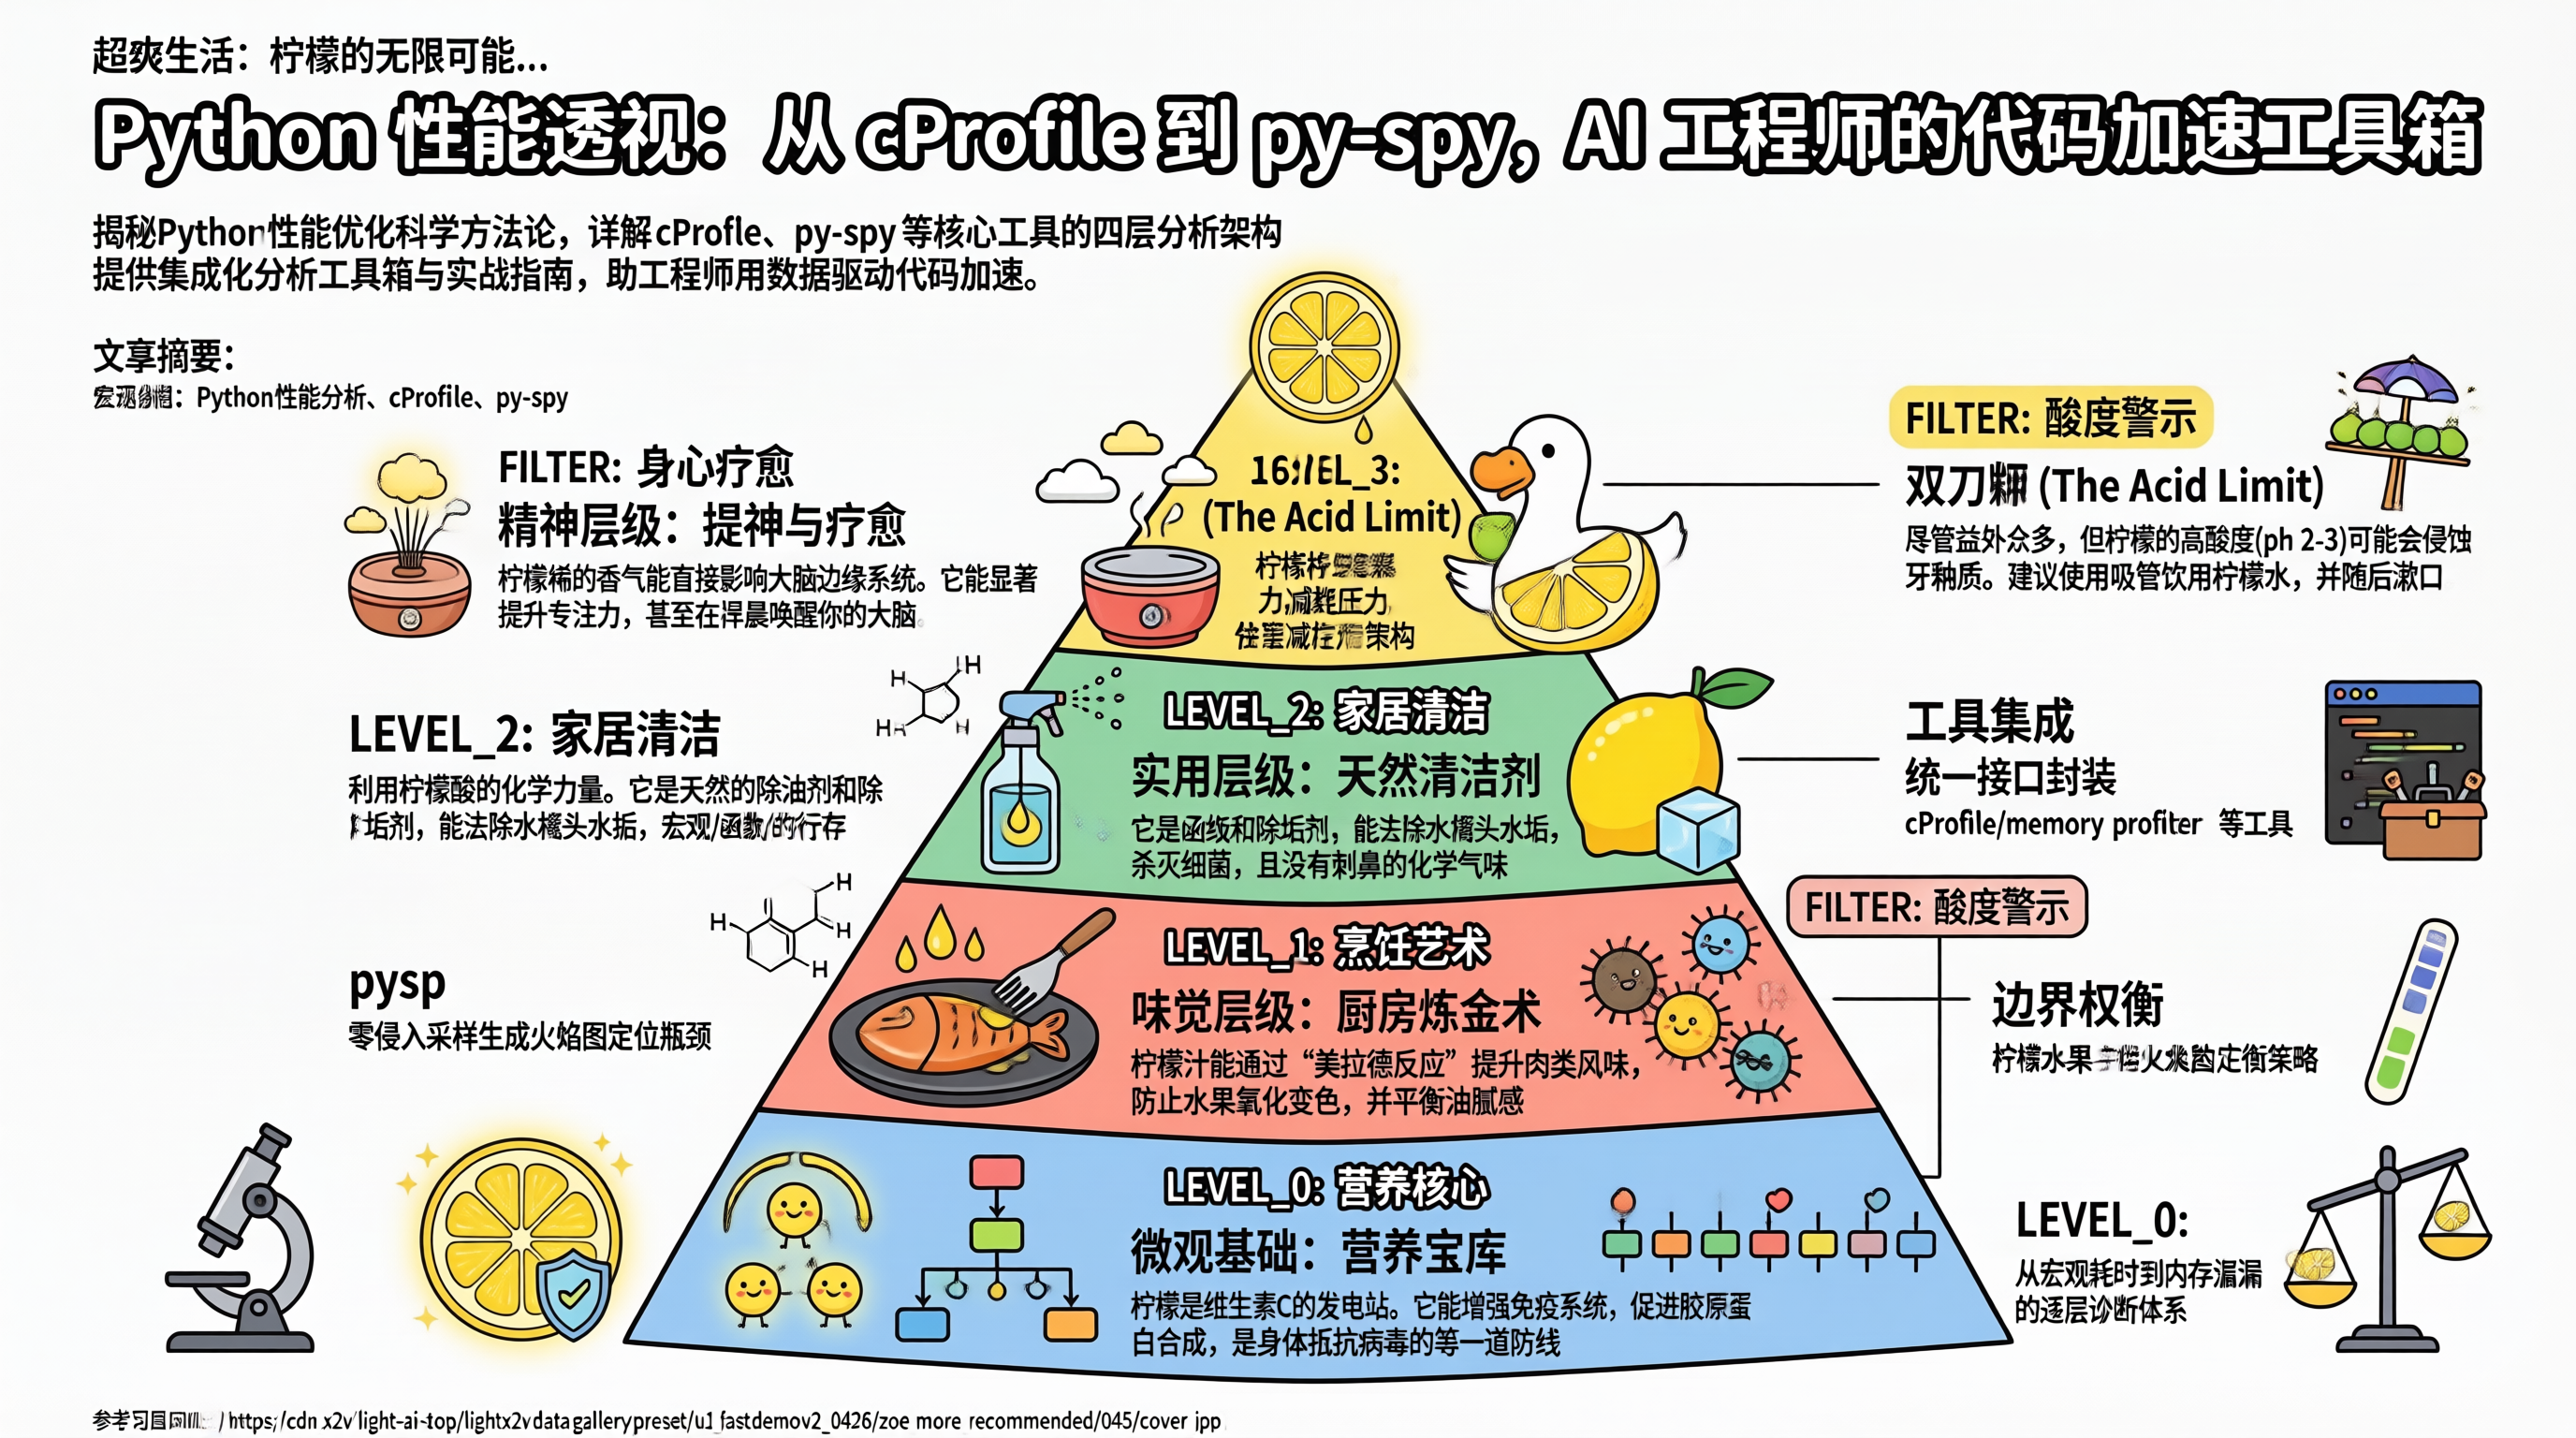
Python 性能分析的核心思路是:宏观分析(整体耗时分布)→ 函数级分析(哪个函数慢)→ 行级分析(哪行代码慢)→ 内存分析(哪里吃内存)。
flowchart TD
A[Python 性能分析四层模型] –> B[宏观分析: 整体耗时]
A –> C[函数级分析: 哪个函数慢]
A –> D[行级分析: 哪行代码慢]
A –> E[内存分析: 哪里吃内存]
B –> B1[cProfile: 标准库]
B –> B2[py-spy: 采样分析器]
B –> B3[yappi: 多线程分析]
B1 –> B1a[确定性分析: 精确但有开销]
B1 –> B1b[输出: 按耗时排序的函数列表]
B2 –> B2a[采样分析: 低开销、可挂载运行进程]
B2 –> B2b[输出: flamegraph 火焰图]
B3 –> B3a[支持多线程/协程]
B3 –> B3b[输出: 按线程分组的统计]
C –> C1[cProfile 统计排序]
C –> C2[snakeviz: 可视化]
C –> C3[gprof2dot: 调用图]
C1 –> C1a[cumtime: 累计耗时]
C1 –> C1b[tottime: 自身耗时]
C2 –> C2a[交互式瀑布图]
C3 –> C3a[DOT 格式调用关系]
D –> D1[line_profiler: 逐行分析]
D –> D2[pyinstrument: 栈帧采样]
D1 –> D1a[@profile 装饰器]
D1 –> D1b[每行耗时 + 命中次数]
D2 –> D2a[低开销采样]
D2 –> D2b[彩色终端输出]
E –> E1[memory_profiler: 逐行内存]
E –> E2[objgraph: 对象引用图]
E –> E3[tracemalloc: 内存分配追踪]
E1 –> E1a[每行内存增量]
E2 –> E2a[循环引用检测]
E3 –> E3a[内存快照对比]
style B fill:#e1f5fe
style C fill:#fff3e0
style D fill:#e8f5e9
style E fill:#fce4ec
2.1 性能分析工具集成
# profiler_toolkit.py — Python 性能分析工具箱
# 设计意图:集成多种性能分析工具,提供统一的分析接口,
# 支持一键分析、对比报告和优化建议
import cProfile
import pstats
import io
import time
import functools
from typing import Callable, Optional, Dict, List, Any
from dataclasses import dataclass, field
from contextlib import contextmanager
import logging
logger = logging.getLogger(__name__)
@dataclass
class ProfileResult:
"""性能分析结果"""
total_time: float
top_functions: List[Dict] # 耗时最多的函数
call_count: Dict[str, int] # 函数调用次数
bottlenecks: List[str] # 瓶颈分析
suggestions: List[str] # 优化建议
class CPUProfiler:
"""CPU 性能分析器"""
@staticmethod
def profile(
func: Optional[Callable] = None,
sort_by: str = "cumulative",
top_n: int = 20,
):
"""
装饰器:对函数进行 cProfile 分析
用法:
@CPUProfiler.profile
def my_slow_function():
…
@CPUProfiler.profile(sort_by="tottime", top_n=10)
def my_slow_function():
…
"""
def decorator(fn):
@functools.wraps(fn)
def wrapper(*args, **kwargs):
profiler = cProfile.Profile()
result = profiler.runcall(fn, *args, **kwargs)
# 生成统计报告
stream = io.StringIO()
stats = pstats.Stats(profiler, stream=stream)
stats.sort_stats(sort_by)
stats.print_stats(top_n)
report = stream.getvalue()
logger.info(f"\\n{'='*60}\\n性能分析: {fn.__name__}\\n{'='*60}\\n{report}")
return result
return wrapper
if func is not None:
return decorator(func)
return decorator
@staticmethod
@contextmanager
def profile_block(name: str = "block", top_n: int = 20):
"""
上下文管理器:对代码块进行性能分析
用法:
with CPUProfiler.profile_block("data_processing"):
process_data()
"""
profiler = cProfile.Profile()
profiler.enable()
try:
yield profiler
finally:
profiler.disable()
stream = io.StringIO()
stats = pstats.Stats(profiler, stream=stream)
stats.sort_stats("cumulative")
stats.print_stats(top_n)
report = stream.getvalue()
logger.info(f"\\n{'='*60}\\n性能分析: {name}\\n{'='*60}\\n{report}")
@staticmethod
def analyze_hotspots(stats_output: str) -> ProfileResult:
"""
分析 cProfile 输出,提取热点函数和优化建议
Args:
stats_output: cProfile 的文本输出
"""
hotspots = []
bottlenecks = []
suggestions = []
for line in stats_output.split("\\n"):
parts = line.split()
if len(parts) >= 6:
try:
cumtime = float(parts[3])
tottime = float(parts[1])
func_name = " ".join(parts[5:])
hotspots.append({
"function": func_name,
"total_time": tottime,
"cumulative_time": cumtime,
"calls": int(parts[0]),
})
# 瓶颈检测
if tottime > 1.0 and "method" not in func_name.lower():
bottlenecks.append(f"{func_name}: 自身耗时 {tottime:.2f}s")
# 优化建议
if "append" in func_name and int(parts[0]) > 100000:
suggestions.append(
f"{func_name}: 调用 {parts[0]} 次,"
"考虑预分配列表或使用 numpy 数组"
)
if "join" in func_name and tottime > 0.5:
suggestions.append(
f"{func_name}: 字符串拼接耗时 {tottime:.2f}s,"
"考虑使用列表推导 + 一次性 join"
)
except (ValueError, IndexError):
continue
hotspots.sort(key=lambda x: x["total_time"], reverse=True)
return ProfileResult(
total_time=hotspots[0]["cumulative_time"] if hotspots else 0,
top_functions=hotspots[:10],
call_count={h["function"]: h["calls"] for h in hotspots},
bottlenecks=bottlenecks[:5],
suggestions=suggestions[:5],
)
class MemoryProfiler:
"""内存分析器"""
@staticmethod
def profile(func: Optional[Callable] = None, interval: float = 0.1):
"""
装饰器:对函数进行内存分析
需要: pip install memory-profiler
"""
def decorator(fn):
@functools.wraps(fn)
def wrapper(*args, **kwargs):
try:
from memory_profiler import memory_usage
# 测量内存使用
mem_usage = memory_usage(
(fn, args, kwargs),
interval=interval,
timeout=None,
)
max_mem = max(mem_usage)
min_mem = min(mem_usage)
increment = max_mem – min_mem
logger.info(
f"\\n{'='*60}\\n内存分析: {fn.__name__}\\n{'='*60}\\n"
f"最小内存: {min_mem:.1f} MB\\n"
f"最大内存: {max_mem:.1f} MB\\n"
f"内存增量: {increment:.1f} MB\\n"
)
if increment > 500:
logger.warning(
f"内存增量 {increment:.1f} MB 较大,"
"可能存在内存泄漏或数据未释放"
)
except ImportError:
logger.warning("memory-profiler 未安装,跳过内存分析")
return fn(*args, **kwargs)
return fn(*args, **kwargs)
return wrapper
if func is not None:
return decorator(func)
return decorator
class LineProfiler:
"""行级分析器"""
@staticmethod
def profile(func: Optional[Callable] = None):
"""
装饰器:对函数进行逐行分析
需要: pip install line-profiler
用法:
@LineProfiler.profile
def my_function():
line1()
line2()
"""
def decorator(fn):
@functools.wraps(fn)
def wrapper(*args, **kwargs):
try:
from line_profiler import LineProfiler
lp = LineProfiler()
lp_wrapper = lp(fn)
result = lp_wrapper(*args, **kwargs)
# 打印行级分析结果
lp.print_stats()
return result
except ImportError:
logger.warning("line-profiler 未安装,跳过行级分析")
return fn(*args, **kwargs)
return wrapper
if func is not None:
return decorator(func)
return decorator
# ===== 便捷的计时装饰器 =====
def timeit(label: str = ""):
"""
简单的计时装饰器,适合快速定位慢函数
用法:
@timeit("数据加载")
def load_data():
…
"""
def decorator(func):
@functools.wraps(func)
def wrapper(*args, **kwargs):
start = time.perf_counter()
result = func(*args, **kwargs)
elapsed = (time.perf_counter() – start) * 1000
name = label or func.__name__
logger.info(f"[{name}] 耗时: {elapsed:.2f}ms")
return result
return wrapper
return decorator
# ===== 使用示例 =====
if __name__ == "__main__":
import numpy as np
@CPUProfiler.profile(sort_by="cumulative", top_n=10)
def slow_data_processing():
"""模拟一个慢速数据处理流程"""
# 阶段1: 数据生成(慢)
data = []
for i in range(100000):
data.append(np.random.randn(100))
# 阶段2: 字符串拼接(慢)
result_str = ""
for item in data[:1000]:
result_str += str(item.mean()) + ","
# 阶段3: 向量化计算(快)
arr = np.array(data)
means = arr.mean(axis=1)
return means
slow_data_processing()
2.2 py-spy 采样分析器使用指南
#!/bin/bash
# pyspy_guide.sh — py-spy 使用指南
# 设计意图:py-spy 是无需修改代码的采样分析器,
# 可以直接挂载到运行中的 Python 进程,零侵入
# ===== 安装 =====
# pip install py-spy
# ===== 场景 1:分析运行中的脚本 =====
# 直接运行并生成分析报告
py-spy record -o profile.svg — python train_model.py
# 生成火焰图(推荐!直观展示调用栈和时间占比)
py-spy record -o flamegraph.svg –duration 60 — python train_model.py
# ===== 场景 2:挂载到运行中的进程 =====
# 先找到进程 PID
ps aux | grep python
# 实时查看调用栈
py-spy top –pid 12345
# 采样 60 秒生成火焰图
py-spy record -o profile.svg –pid 12345 –duration 60
# ===== 场景 3:快速诊断 =====
# dump 当前调用栈(一次性快照)
py-spy dump –pid 12345
# 查看函数耗时排行
py-spy top –pid 12345 –rate 100
# ===== 输出格式 =====
# flamegraph.svg — 火焰图(最直观,推荐)
# profile.svg — 速度图
# profile.json — JSON 格式(可二次处理)
# ===== 注意事项 =====
# 1. py-spy 需要 root 权限或 ptrace 权限
# 2. 采样率默认 100Hz,可调高到 1000Hz(–rate 1000)
# 3. 采样分析有统计误差,短时函数可能被遗漏
# 4. 不影响被分析进程的性能(开销 <5%)
四、边界分析与架构权衡
cProfile 的开销:cProfile 是确定性分析器,每个函数调用都记录,开销约 10-30%。对于高频调用的小函数(如 getitem),cProfile 自身的开销可能超过函数本身的执行时间。建议:先用 py-spy 采样分析定位大致瓶颈,再用 cProfile 精确分析具体函数。
采样分析的统计误差:py-spy 以固定频率采样调用栈,短时函数可能被遗漏。如果一个函数只占 1% 的运行时间,采样 100 次可能只捕获到 1 次。建议:采样时间至少 30 秒,采样率设为 100-1000 Hz。
内存分析的精度:memory_profiler 的精度取决于采样间隔(默认 0.1 秒),短时内存峰值可能被遗漏。对于精确的内存分析,建议使用 tracemalloc(标准库,可追踪每次内存分配)。
行级分析的适用场景:line_profiler 对每行代码计时,精度最高但开销也最大(约 2-5 倍慢)。只对已定位的慢函数使用行级分析,不要对整个程序使用。先用 cProfile 找到慢函数,再用 line_profiler 分析具体行。
五、总结
Python 性能分析是从玄学到科学的进化——cProfile 定位慢函数,line_profiler 定位慢代码行,memory_profiler 定位内存瓶颈,py-spy 零侵入采样分析。落地建议:先用 py-spy 生成火焰图宏观定位瓶颈(零侵入、低开销),再用 cProfile 精确分析具体函数,最后用 line_profiler 分析关键代码行;内存问题用 memory_profiler + tracemalloc 双重确认;日常开发用 @timeit 快速计时。记住,优化之前先测量——就像 Tensor 身体不适先量体温,代码性能问题先跑 profile。没有数据的优化是玄学,有数据的优化才是科学。