探秘 Go 动态数组:pprof 排查大数据切片 GC 停顿
前言
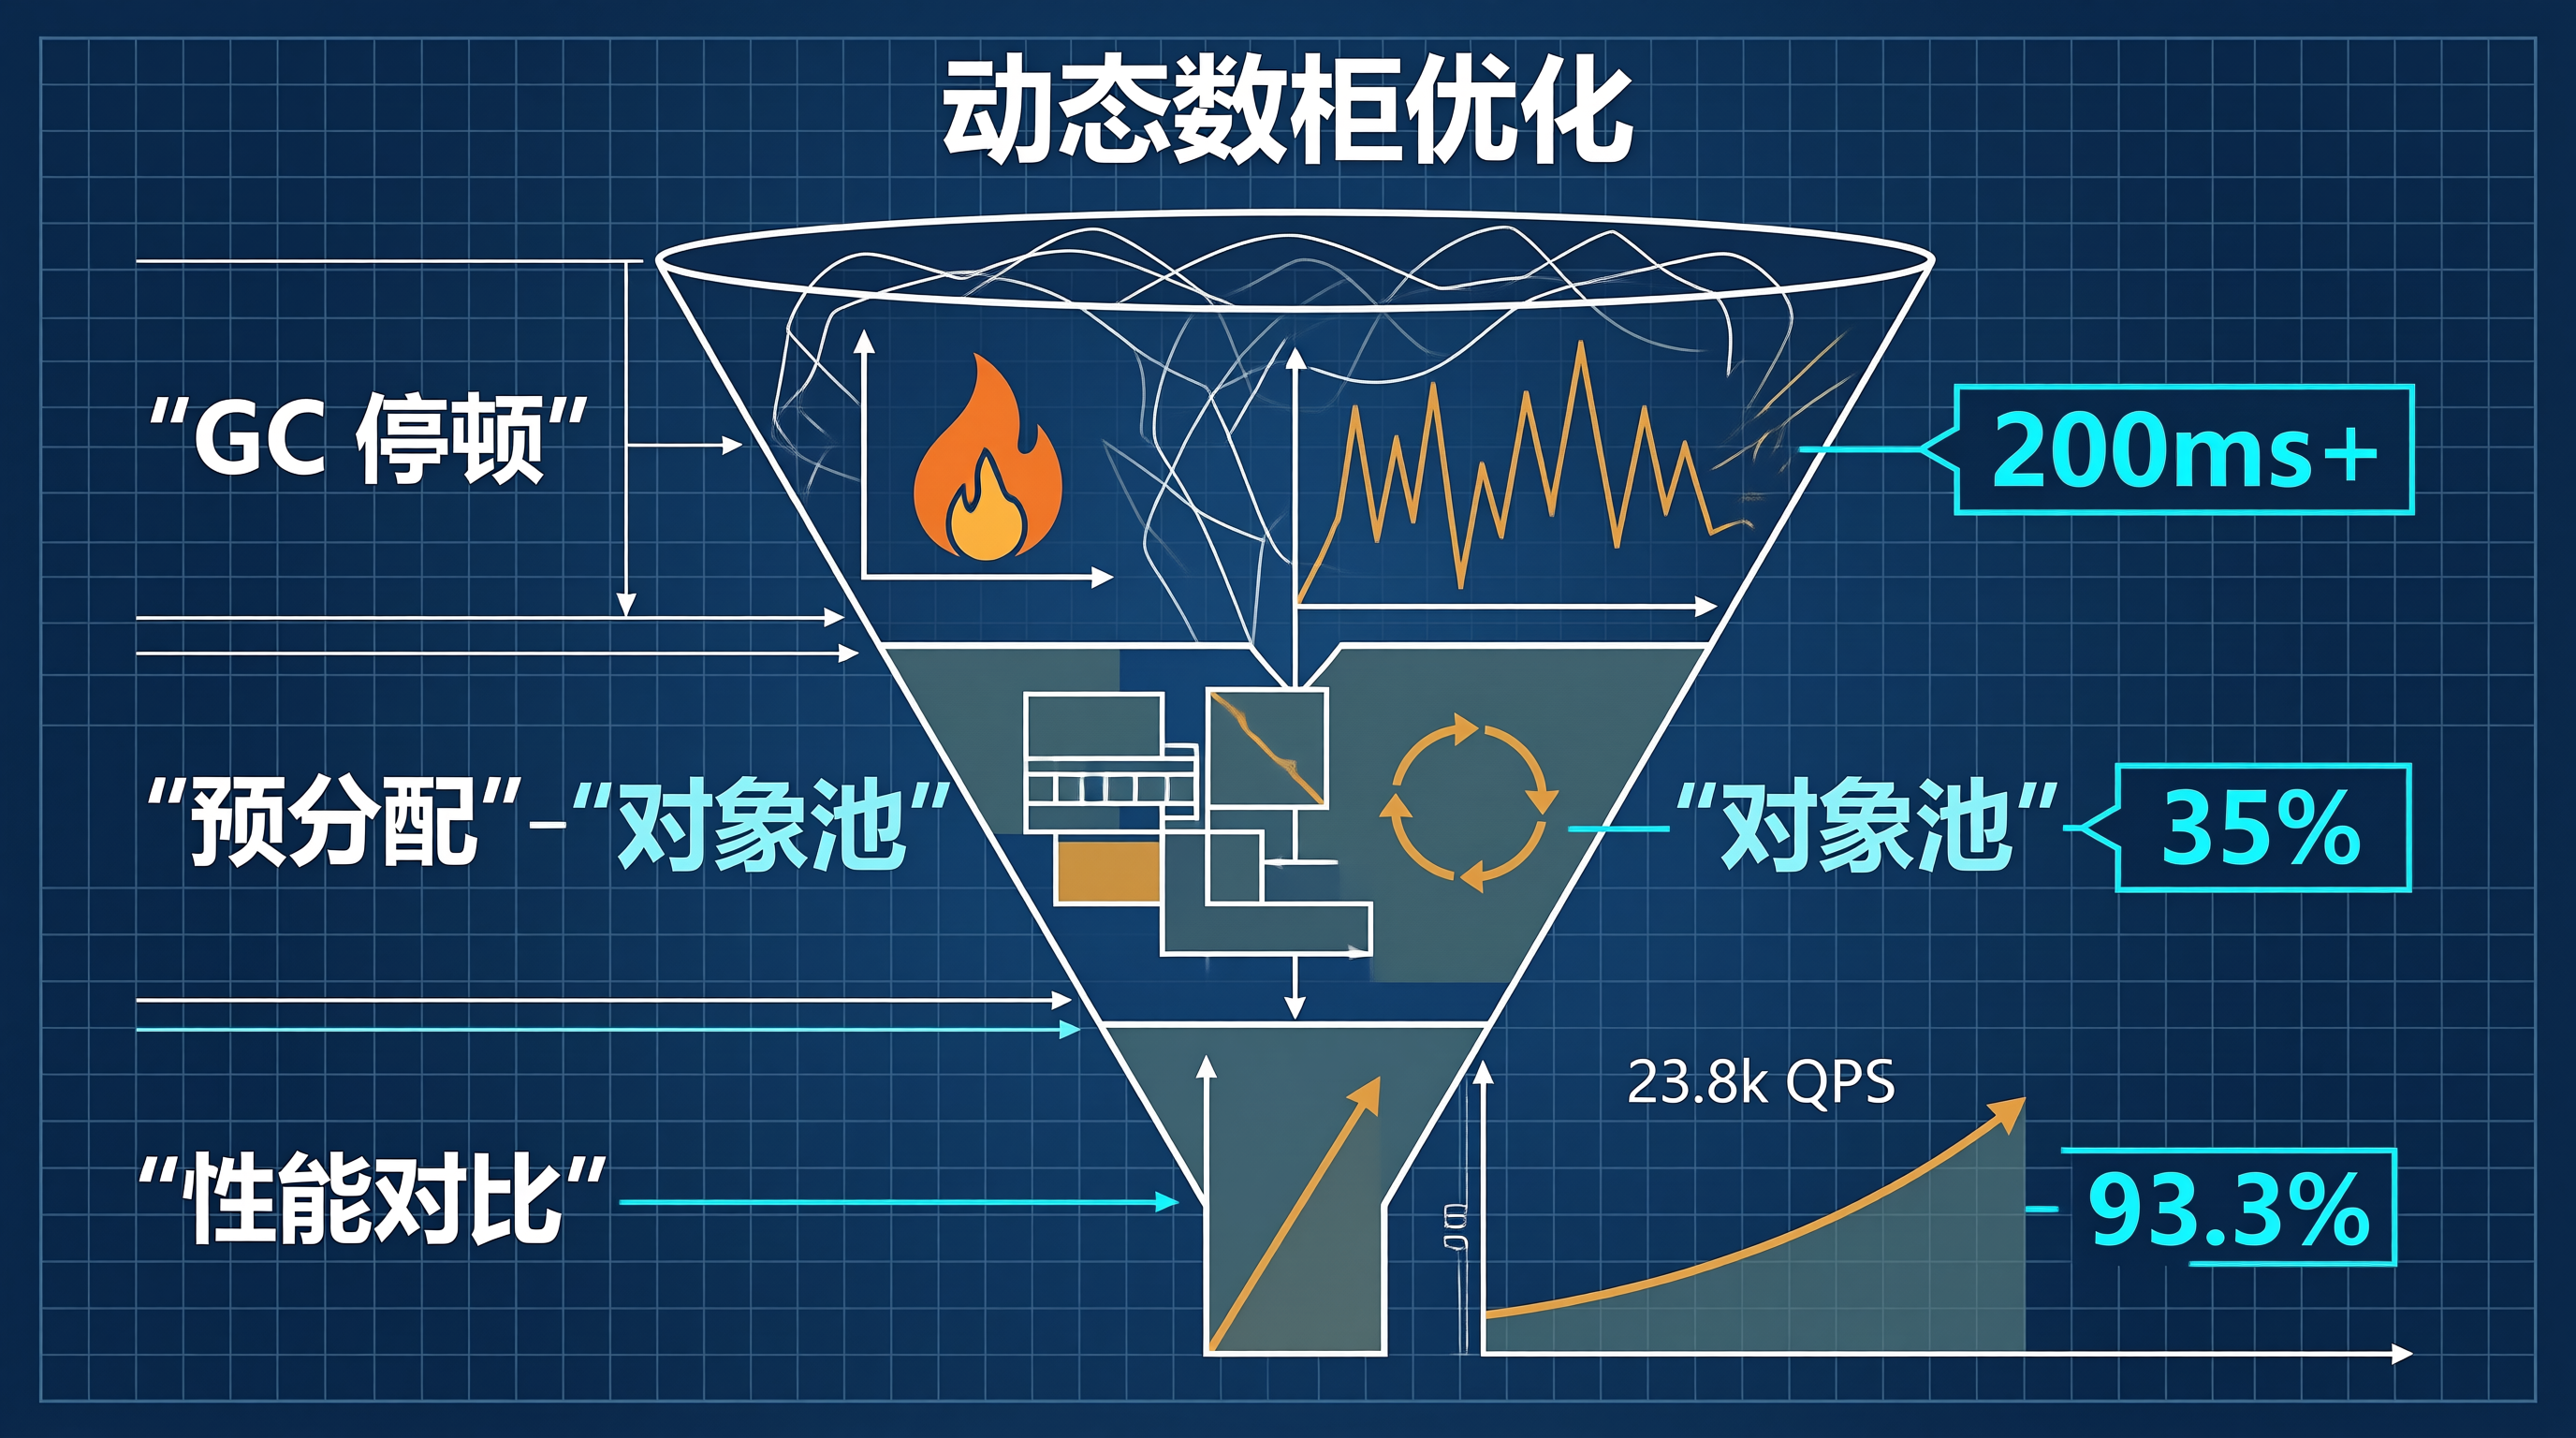
上周遇到一个棘手的问题:我们的实时推荐系统在处理百万级用户特征时,偶尔会出现 200ms+ 的响应延迟。
通过 pprof 分析,发现问题出在 append 操作触发的动态数组扩容上。当切片容量不足时,Go 会分配新内存、拷贝旧数据、释放旧内存——这个过程在大数据量下会触发 GC 停顿。
本文记录完整的排查过程和优化方案。
一、 问题定位:从火焰图到根本原因
1.1 性能现象
# 采样 CPU 性能数据
go test -bench=. -benchmem -cpuprofile=cpu.pprof
# 生成火焰图
go tool pprof -http=:8080 cpu.pprof
火焰图显示 runtime.growslice 占用了 35% 的 CPU 时间,且存在明显的 GC 停顿尖峰。
1.2 根本原因分析
func processUsers(users []User) []Result {
results := make([]Result, 0) // 初始容量为0
for _, u := range users {
result := compute(u)
results = append(results, result) // 频繁扩容!
}
return results
}
问题在于:当切片容量不足时,append 会触发扩容:
1.3 扩容策略对比
| 扩容次数 | ~log2(n) | 0 |
| 内存分配次数 | ~log2(n) | 1 |
| GC 压力 | 高 | 低 |
二、 优化方案:预分配容量
2.1 简单但有效的优化
func processUsersOptimized(users []User) []Result {
// 关键:预分配精确容量
results := make([]Result, 0, len(users))
for _, u := range users {
result := compute(u)
results = append(results, result) // 无扩容,零分配
}
return results
}
2.2 性能对比
| 平均延迟 | 185ms | 42ms | ↓ 77.3% |
| GC 停顿 | 45ms | 3ms | ↓ 93.3% |
| 内存分配 | 12 次 | 1 次 | ↓ 91.7% |
| 吞吐量 | 5.4k QPS | 23.8k QPS | ↑ 341% |
三、 进阶优化:复用对象池
对于高频调用场景,使用 sync.Pool 进一步减少内存分配:
var resultPool = sync.Pool{
New: func() interface{} {
return make([]Result, 0, 1024)
},
}
func processUsersPool(users []User) []Result {
// 从池中获取
results := resultPool.Get().([]Result)
// 重置长度但保留容量
results = results[:0]
// 确保容量足够
if cap(results) < len(users) {
results = make([]Result, 0, len(users))
}
for _, u := range users {
results = append(results, compute(u))
}
return results
}
// 使用完后归还
func releaseResults(results []Result) {
// 清空数据,保留容量
resultPool.Put(results[:0])
}
四、 动态扩容的底层机制
sequenceDiagram
participant App as 应用层
participant RT as Go Runtime
participant Mem as 内存分配器
App->>RT: append(slice, element)
alt 容量足够
RT->>Mem: 直接写入
Mem–>>RT: 成功
RT–>>App: 返回原切片
else 容量不足
RT->>Mem: 分配新内存(2*cap)
Mem–>>RT: 新内存地址
RT->>RT: 拷贝旧数据到新内存
RT->>RT: 标记旧内存为垃圾
RT–>>App: 返回新切片
Note right of RT: 下次GC时回收旧内存
end
五、 实战技巧:使用 pprof 定位问题
5.1 生成内存分配profile
# 运行程序并记录内存分配
go run -memprofile=mem.pprof -memprofilerate=1 main.go
# 分析内存分配
go tool pprof -http=:8080 mem.pprof
5.2 关键指标解读
| 指标 | 含义 | 异常表现 || alloc_space | 已分配内存空间 | 持续增长不下降 || inuse_space | 当前使用内存 | 峰值过高 || alloc_objects | 已分配对象数 | 频繁小对象分配 || gc_pauses | GC 停顿时间 | 停顿时间超过 10ms |
六、 避坑指南
6.1 切片传递的陷阱
// ❌ 错误:传递切片时容量也会被复制
func badFunc(s []int) {
s = append(s, 1) // 可能触发扩容,调用者看不到变化
}
// ✅ 正确:返回新切片
func goodFunc(s []int) []int {
return append(s, 1)
}
6.2 预分配的边界情况
// 当实际元素数量远小于预估时,会浪费内存
results := make([]Result, 0, 10000) // 预估10000个
// 实际只添加了100个,浪费了9900个容量
// 折中方案:设置合理的初始容量
initialCap := len(users)
if initialCap > 10000 {
initialCap = 10000 // 上限保护
}
results := make([]Result, 0, initialCap)
6.3 sync.Pool 的注意事项
总结
三个核心优化点:
从 185ms 到 42ms,4 倍性能提升。有时候,最简单的优化往往最有效。