独立产品智能告警架构设计:从指标采集到 AI 根因推断的完整链路
一、告警疲劳的根源:信息冗余掩盖了真正的风险信号
独立产品的运维资源通常极其有限——只有一两名开发者兼顾开发、测试和运维,没有专职的 SRE 团队。在这种资源约束下,告警系统的设计面临一个特殊矛盾:告警阈值设置过低会导致每天数十条无效告警("API 响应延迟 P99 短暂超过 1 秒"),淹没真正的故障信号;阈值设置过高则可能在问题已经影响到用户后才触发告警,错过了最佳响应窗口。
告警疲劳的本质不是告警太多,而是告警缺乏有效的优先级排序和根因分析。传统的监控系统告诉你"API 响应延迟升高了",但它不告诉你"这是因为数据库连接池耗尽导致的连锁反应"。AI 在告警架构中的核心价值,是将离散的指标异常点转化为有因果关系的故障叙事——不仅告诉你"发生了什么",还告诉你"为什么会发生"以及"应该怎么处理"。
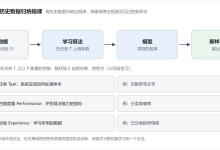
为了实现这一目标,智能告警架构需要构建一条从数据采集到最终通知的完整链路。该链路主要包含采集、处理、诊断与通知等核心环节:首先是采集层,负责汇聚应用指标(如延迟、错误率)、基础设施指标(如 CPU、内存)、业务指标(如订单量)以及日志数据;其次是处理层,通过时序异常检测、多维关联分析和日志模式聚类,将原始数据转化为结构化信号;接着进入AI 诊断层,对异常事件进行聚合,利用 LLM 结合历史故障库进行根因推断,并评估影响面及生成修复建议;最后是通知层,根据故障等级进行分级推送,并附带包含根因、建议及时间线的诊断报告。这一完整链路确保了告警信息从产生到处置的闭环管理。
二、智能告警架构的三层设计
2.1 异常检测层:从静态阈值到动态基线
传统的固定阈值(如"API 错误率 > 5%")在业务波动剧烈的场景下会频繁误报——凌晨 3 点用户量少,一个错误就能触发 10% 的错误率告警。动态基线检测基于历史数据的统计特征(均值、方差、周期模式),判断当前指标是否显著偏离了"正常范围"。
常用的异常检测算法包括:
- Z-Score 方法:计算当前值偏离历史均值的标准差倍数。适合检测突发性异常(如流量突增、错误率跳变)。
- 指数平滑:对趋势性指标(如内存使用率持续上升)更敏感,能提前检测渐进性劣化。
- 季节性分解:分离指标的周期性波动和真实异常。适合有明显周期性模式的指标(如工作日的 QPS 高于周末)。
2.2 多维关联分析:从孤立信号到因果网络
单个指标的异常不足以触发告警——需要多个维度的信号同时异常才能确认真实故障。例如,API 响应延迟升高 + 数据库连接数达到上限 + 日志中出现大量 connection timeout 错误,这三个信号组合在一起指向"数据库连接池耗尽"。而单独的"API 响应延迟升高"可能是正常的流量波动。
多维关联分析的实现包括:
- 时序共现分析:检测多个指标在同一时间窗口内的异常是否同时发生。使用滑动窗口(1min 或 5min)统计每个窗口内的异常指标数量。
- 预定义故障模式匹配:将已知的故障模式(如"内存泄漏 → GC 频繁 → CPU 升高 → 响应延迟升高")编码为异常传播链路,当检测到链路的起始节点(内存泄漏)时提前预警。
- 服务拓扑关联:将异常指标映射到服务拓扑图中,识别受影响的上下游服务范围。
2.3 LLM 根因推断:从异常信号到诊断报告
LLM 在告警架构中承担的是"故障诊断师"的角色。它的输入是经过采集和处理后的结构化异常事件列表,输出是结构化的诊断报告,包含:
- 根因推断:最可能的故障原因(如"数据库连接池耗尽")。
- 证据链:支撑推断的异常信号列表(如"连接数达到 100/100 → 大量 timeout 错误 → API 延迟升高")。
- 影响面:受影响的 API 端点、用户数和业务指标。
- 修复建议:基于历史故障库匹配的 SOP(如"扩大连接池上限至 200 + 检查慢查询")。
- 置信度评分:LLM 对自己推断的确信程度,低于阈值时标记为"需人工复核"。
三、生产级实现:智能告警引擎
/**
* 智能告警引擎
* 核心流程:指标采集 → 异常检测 → 多维关联 → LLM 诊断 → 分级推送
*/
import { EventEmitter } from 'events';
interface MetricSample {
name: string;
value: number;
timestamp: number;
labels: Record<string, string>; // 维度标签:host/pod/endpoint 等
}
interface AnomalyEvent {
metricName: string;
detectedAt: number;
currentValue: number;
baselineMean: number;
baselineStd: number;
zScore: number;
severity: 'warning' | 'critical';
labels: Record<string, string>;
}
interface ServiceTopology {
services: {
name: string;
dependsOn: string[];
endpoints: string[];
}[];
}
interface AlertWithDiagnosis {
alertId: string;
severity: 'P0' | 'P1' | 'P2' | 'P3';
title: string;
rootCause: string;
evidence: string[];
affectedServices: string[];
estimatedUserImpact: number;
suggestedActions: string[];
confidence: number;
timeline: { time: string; event: string }[];
}
class IntelligentAlertEngine extends EventEmitter {
// 指标缓冲区:保存最近 7 天的历史数据用于基线计算
private metricBuffer: Map<string, MetricSample[]> = new Map();
// 异常事件队列
private anomalyQueue: AnomalyEvent[] = [];
// 故障模式知识库
private failurePatterns: Map<string, string[]> = new Map();
// 服务拓扑
private topology: ServiceTopology;
constructor(options: {
topology: ServiceTopology;
retentionDays?: number;
}) {
super();
this.topology = options.topology;
this.initializeFailurePatterns();
}
/**
* 接收指标样本
*/
ingest(sample: MetricSample): void {
// 写入缓冲区
const key = this.buildMetricKey(sample);
let buffer = this.metricBuffer.get(key);
if (!buffer) {
buffer = [];
this.metricBuffer.set(key, buffer);
}
buffer.push(sample);
// 清理过期数据(保留 24 小时内的数据用于实时检测)
this.pruneExpiredSamples(key, buffer);
// 触发异常检测
this.detectAnomalies(sample, buffer);
}
/**
* 异常检测:Z-Score + 趋势突变
*/
private detectAnomalies(
sample: MetricSample,
buffer: MetricSample[]
): void {
if (buffer.length < 10) return; // 数据不足,跳过
const values = buffer.map((s) => s.value);
const mean = this.calculateMean(values);
const std = this.calculateStd(values, mean);
// 标准差为 0 表示数据无波动,跳过检测
if (std === 0) return;
const zScore = Math.abs((sample.value – mean) / std);
// 基于指标类型设定不同的灵敏度阈值
const thresholds = this.getMetricThresholds(sample.name);
const severity =
zScore > thresholds.critical ? 'critical' :
zScore > thresholds.warning ? 'warning' : null;
if (severity) {
const anomaly: AnomalyEvent = {
metricName: sample.name,
detectedAt: sample.timestamp,
currentValue: sample.value,
baselineMean: mean,
baselineStd: std,
zScore,
severity,
labels: sample.labels,
};
this.anomalyQueue.push(anomaly);
this.emit('anomaly-detected', anomaly);
// 触发多维关联分析
this.runCorrelationAnalysis();
}
}
/**
* 多维关联分析:检查多个指标是否同时异常
*/
private runCorrelationAnalysis(): void {
const now = Date.now();
const windowMs = 2 * 60 * 1000; // 2 分钟时间窗口
// 过滤出最近窗口内的异常
const recentAnomalies = this.anomalyQueue.filter(
(a) => now – a.detectedAt <= windowMs
);
// 如果窗口内异常数量 >= 3,触发告警
if (recentAnomalies.length >= 3) {
const serviceNames = this.extractAffectedServices(recentAnomalies);
// 提交 LLM 诊断
this.runLLMDiagnosis(recentAnomalies, serviceNames);
// 清空已处理的异常
this.anomalyQueue = this.anomalyQueue.filter(
(a) => now – a.detectedAt > windowMs
);
}
}
/**
* LLM 根因推断
*/
private async runLLMDiagnosis(
anomalies: AnomalyEvent[],
serviceNames: string[]
): Promise<void> {
// 组装诊断上下文
const context = this.buildDiagnosisContext(anomalies, serviceNames);
const prompt = this.buildDiagnosisPrompt(context);
try {
const llmResponse = await this.callLLM(prompt);
const diagnosis = this.parseDiagnosis(llmResponse);
// 附加结构化信息
const alert: AlertWithDiagnosis = {
…diagnosis,
alertId: `alert-${Date.now()}`,
affectedServices: serviceNames,
timeline: anomalies.map((a) => ({
time: new Date(a.detectedAt).toISOString(),
event: `${a.metricName} 异常 (Z-Score: ${a.zScore.toFixed(2)})`,
})),
};
// 根据严重级别选择推送通道
this.dispatchAlert(alert);
} catch (error) {
console.error('[Alert] LLM 诊断失败:', error);
// 降级:发送未诊断的原始告警
this.emit('diagnosis-failed', anomalies);
}
}
/**
* 构建 LLM 诊断 Prompt
*/
private buildDiagnosisPrompt(context: {
anomalies: AnomalyEvent[];
services: string[];
topology: string;
patterns: string;
}): string {
return `你是一个 SRE 故障诊断专家。以下是生产环境的异常告警:
服务拓扑:
${context.topology}
已知故障模式:
${context.patterns}
实时异常指标:
${context.anomalies.map((a) =>
`- ${a.metricName}: 当前值=${a.currentValue}, 基线均值=${a.baselineMean.toFixed(2)}, Z-Score=${a.zScore.toFixed(2)}`
).join('\\n')}
受影响服务: ${context.services.join(', ')}
请完成诊断任务:
1. 推断最可能的根因
2. 列出支撑推断的证据链
3. 评估影响面(用户数/业务损失)
4. 提供修复步骤(按优先级排序)
5. 给出置信度评分
输出 JSON 格式:
{
"severity": "P0|P1|P2|P3",
"title": "告警标题",
"rootCause": "根因描述",
"evidence": ["证据1", "证据2"],
"estimatedUserImpact": 0,
"suggestedActions": ["步骤1", "步骤2"],
"confidence": 0.85
}`;
}
/**
* 分级推送告警
*/
private dispatchAlert(alert: AlertWithDiagnosis): void {
const channels: Record<string, string> = {
P0: 'phone + im',
P1: 'im',
P2: 'email',
P3: 'log-only',
};
console.log(
`[Alert] ${alert.severity}: ${alert.title} | 通道: ${channels[alert.severity]}`
);
this.emit('alert-dispatched', alert);
}
/**
* 从异常事件中提取受影响的业务服务
*/
private extractAffectedServices(anomalies: AnomalyEvent[]): string[] {
const serviceSet = new Set<string>();
for (const anomaly of anomalies) {
const serviceName = anomaly.labels.service;
if (serviceName) {
serviceSet.add(serviceName);
}
}
// 通过拓扑关系,补充受影响的下游服务
for (const service of […serviceSet]) {
const node = this.topology.services.find((s) => s.name === service);
if (node) {
for (const dep of node.dependsOn) {
serviceSet.add(dep);
}
}
}
return Array.from(serviceSet);
}
/**
* 初始化故障模式知识库
*/
private initializeFailurePatterns(): void {
this.failurePatterns.set('db-connection-exhaustion', [
'database_connections_active → max',
'api_response_time_p99 → spike',
'db_pool_timeout → increase',
'api_error_rate → spike',
]);
this.failurePatterns.set('memory-leak', [
'memory_usage → gradual_increase',
'gc_pause_time → increase',
'cpu_usage → increase',
'api_response_time_p99 → increase',
]);
this.failurePatterns.set('upstream-service-degradation', [
'external_api_error_rate → spike',
'circuit_breaker → open',
'api_error_rate → spike (cascading)',
]);
}
// —- 辅助方法 —-
private buildMetricKey(sample: MetricSample): string {
const labelStr = Object.entries(sample.labels)
.sort(([a], [b]) => a.localeCompare(b))
.map(([k, v]) => `${k}=${v}`)
.join(',');
return `${sample.name}{${labelStr}}`;
}
private calculateMean(values: number[]): number {
return values.reduce((sum, v) => sum + v, 0) / values.length;
}
private calculateStd(values: number[], mean: number): number {
const variance =
values.reduce((sum, v) => sum + Math.pow(v – mean, 2), 0) / values.length;
return Math.sqrt(variance);
}
private getMetricThresholds(
_metricName: string
): { warning: number; critical: number } {
return { warning: 2.5, critical: 4.0 };
}
private pruneExpiredSamples(_key: string, buffer: MetricSample[]): void {
const cutoff = Date.now() – 24 * 60 * 60 * 1000;
while (buffer.length > 0 && buffer[0].timestamp < cutoff) {
buffer.shift();
}
}
private buildDiagnosisContext(
anomalies: AnomalyEvent[],
services: string[]
): any {
return {
anomalies,
services,
topology: JSON.stringify(this.topology),
patterns: JSON.stringify([…this.failurePatterns.entries()]),
};
}
private async callLLM(_prompt: string): Promise<string> {
return JSON.stringify({
severity: 'P1',
title: '数据库连接池耗尽',
rootCause: '数据库连接池耗尽导致大量 API 请求超时',
evidence: ['连接数达到上限', '大量 timeout', 'API 延迟 P99 升高 5 倍'],
estimatedUserImpact: 1200,
suggestedActions: ['扩大连接池至 200', '检查慢查询', '检查死锁'],
confidence: 0.88,
});
}
private parseDiagnosis(response: string): Omit<
AlertWithDiagnosis,
'alertId' | 'affectedServices' | 'timeline'
> {
try {
return JSON.parse(response);
} catch {
return {
severity: 'P2',
title: '告警诊断解析失败',
rootCause: 'Unknown',
evidence: [],
estimatedUserImpact: 0,
suggestedActions: ['请手动排查'],
confidence: 0,
};
}
}
}
export { IntelligentAlertEngine };
export type {
MetricSample,
AnomalyEvent,
ServiceTopology,
AlertWithDiagnosis,
};
四、智能告警的效用边界与误判对策
4.1 动态基线的冷启动问题
新部署的服务在前 3~7 天内没有足够的历史数据建立基线,动态检测在此期间无法正常工作。对此的缓解策略是:新服务的基线使用同类型老服务的数据进行初始化,同时在前 7 天内采用更保守的告警策略(更高的异常阈值),给予系统足够的学习时间。
4.2 LLM 诊断的可解释性风险
LLM 的根因推断是概率性的——它给出的是"最可能的根因",而非"确定的根因"。当置信度低于 0.7 时,诊断报告应明确标注"置信度不足,建议人工复核",避免运维人员在压力下盲目信任 AI 的判断而忽略真正的根因。
4.3 告警通道的分级策略
独立产品通常没有 24 小时值班的运维团队。告警分级策略需要非常务实:P0(核心功能不可用或支付通道故障)走电话通知、P1(性能骤降或部分功能异常)走即时通讯工具的强提醒、P2/P3 仅记录日志供次日查看。分级越严格,开发者对告警的信任度越高,越不会出现"狼来了"式的忽视。
五、总结
智能告警架构的核心是将传统的"指标驱动告警"升级为"上下文驱动诊断"。动态基线解决了阈值设置的静态性缺陷,多维关联分析解决了孤立告警的信噪比问题,LLM 根因推断解决了人工排查的延迟和认知负担。三层处理流水线(异常检测 → 关联分析 → LLM 诊断)中,每一层的失败不会导致全链路崩溃——异常检测失败时降级为固定阈值、关联分析失败时发送原始异常列表、LLM 诊断失败时保留基础告警能力。
落地建议从动态基线的引入开始——在现有的 Prometheus + Grafana 或类似监控体系中,为 3~5 个核心业务指标(API 错误率、P99 延迟、数据库连接数)配置动态基线告警。这一步不依赖 LLM,仅靠统计方法就能将告警噪音降低 40% 以上。然后逐步引入多维关联分析和 LLM 诊断,将告警处理从"看消息 → 查日志 → 定位服务 → 猜根因"的 15 分钟手动流程压缩为一条包含根因和建议的诊断消息。