Kafka 大规模集群治理:数万 Partition 的元数据压力、GC 调优与限流保护
随着业务规模的扩大,Kafka 集群中的 Partition 数量可能达到数万个级别。这种规模的元数据管理给集群带来了巨大压力,主要表现在以下几个方面:
首先,ZooKeeper 作为 Kafka 集群的元数据存储中心,需要维护所有 Topic、Partition、Broker 等信息。当 Partition 数量激增时,ZooKeeper 的 Znode 数量同步增长,导致 ZooKeeper 集群负载过高,出现响应延迟甚至 ZooKeeper 会话超时的问题。
其次,Kafka Broker 需要维护每个 Partition 的状态信息,包括 Leader 选举、ISR 列表、副本状态等。当 Broker 上承担的 Partition 数量过多时,Broker 的内存占用会急剧增加,同时处理元数据更新的 CPU 开销也会显著提高。
此外,大规模 Partition 还会导致网络流量增加。每个 Partition 的元数据变更都需要通过 ZooKeeper 协调并广播到所有相关 Broker,这会加剧网络拥塞,影响集群整体性能。
在实际运维中,我们观察到当单个 Broker 上的 Partition 超过 5000 个时,Broker 的 CPU 使用率会显著上升,同时 ZooKeeper 的响应时间也会延长,最终影响消息的发送和接收性能。
针对元数据压力问题,我们可以采取以下优化策略:
首先,合理的 Topic 和 Partition 规划是基础。对于业务上相似的消息类型,可以考虑合并 Topic 减少整体元数据量。同时,避免创建过多的空 Partition 或极少消息的 Partition,这只会增加元数据负担而不会带来性能提升。
其次,合理分配 Partition 到 Broker 是关键。通过自定义分区器,我们可以根据 Broker 的负载情况智能分配 Partition,避免某些 Broker 承担过多 Partition。Kafka 提供了 rack-aware 策略,可以将 Partition 的副本分布在不同机架的 Broker 上,提高集群可用性。
第三,启用 Kafka 的元数据缓存机制。Kafka 2.8.0 版本开始支持客户端元数据缓存,可以减少对 Broker 的元数据查询请求。同时,合理设置 metadata.max.age.ms 参数,避免频繁刷新元数据。
此外,我们可以定期清理不再使用的 Topic 和 Partition,释放元数据资源。Kafka 提供了 delete.topic.enable=true 配置来启用主题删除功能,同时可以通过工具自动识别并清理长期未使用的 Topic。
最后,监控元数据健康状态也是必不可少的。我们可以使用 JMX 监控 ZooKeeper 的连接数、Kafka Broker 的元数据缓存命中率等指标,及时发现元数据异常。
在 Kafka 大规模集群中,JVM GC 调优对于 Broker 稳定性至关重要。数万 Partition 会导致 Broker 需要频繁处理大量对象创建和销毁,这对垃圾回收器提出了极高要求。
首先,我们需要为 Broker 分配足够的堆内存。对于管理大量 Partition 的 Broker,建议将堆内存设置为 16GB-32GB,并通过 -XX:+UseG1GC 启用 G1 垃圾回收器,适合处理大内存应用。
下面是一个典型的 JVM 启动参数示例:
java -Xmx16g -Xms16g -XX:+UseG1GC -XX:MaxGCPauseMillis=200 -XX:ParallelGCThreads=8 -XX:ConcGCThreads=5 -XX:InitiatingHeapOccupancyPercent=35 -XX:G1HeapRegionSize=16m -XX:G1ReservePercent=15 -XX:G1HeapWastePercent=5 -XX:G1MixedGCCountTarget=4 -XX:G1MixedGCLiveThresholdPercent=90 -XX:G1RSetUpdatingPauseTimePercent=5 -XX:SurvivorRatio=6 -XX:+DisableExplicitGC -XX:+UnlockExperimentalVMOptions -XX:+AggressiveOpts -XX:+OptimizeStringConcat -XX:+UseStringDeduplication -Xlog:gc*:file=kafka_gc.log:time,tags:filecount=5,filesize=50m -Xlog:gc*:stdout:time,tags -jar kafka-server-start.sh …
参数解释:
- -Xmx16g -Xms16g:设置堆内存大小为 16GB,初始堆内存大小也设置为 16GB
- -XX:+UseG1GC:使用 G1 垃圾回收器
- -XX:MaxGCPauseMillis=200:设置最大 GC 停顿时间为 200ms
- -XX:ParallelGCThreads=8:设置并行垃圾回收的线程数为 8
- -XX:ConcGCThreads=5:设置并发垃圾回收的线程数为 5
- -XX:InitiatingHeapOccupancyPercent=35:设置触发并发 GC 的堆占用率为 35%
- -XX:G1HeapRegionSize=16m:设置 G1 堆区域大小为 16MB
- -XX:G1ReservePercent=15:设置保留堆空间的百分比为 15%
- -XX:G1HeapWastePercent=5:设置最大允许的堆浪费百分比为 5%
- -XX:G1MixedGCCountTarget=4:设置混合 GC 的目标次数为 4
- -XX:G1MixedGCLiveThresholdPercent=90:设置在混合 GC 中可回收区域的最大存活率为 90%
- -XX:G1RSetUpdatingPauseTimePercent=5:设置更新 Remembered Set 的时间停顿占总停顿时间的比例不超过 5%
- -XX:SurvivorRatio=6:设置新生代中 Eden 区和 Survivor 区的比例为 6:1
- -XX:+DisableExplicitGC:禁用 System.gc() 调用
- -XX:+UnlockExperimentalVMOptions:启用实验性 JVM 选项
- -XX:+AggressiveOpts:启用激进的优化
- -XX:+OptimizeStringConcat:优化字符串连接操作
- -XX:+UseStringDeduplication:启用字符串去重
- -Xlog:gc*:配置 GC 日志输出
除了参数调优,我们还需要定期分析 GC 日志,识别潜在的内存泄漏或 GC 性能问题。可以通过 GCViewer 等工具分析 GC 日志,获取 GC 停顿时间、吞吐量等关键指标。
在 Kafka 大规模集群中,有效的限流机制是保障集群稳定运行的关键。数万 Partition 可能同时处理大量消息,如果没有适当的限流策略,很容易导致 Broker 资源耗尽。
Kafka 提供了多种限流机制,包括生产者限流、消费者限流和 Broker 端限流。下面我们分别介绍这些限流策略及其配置方法。
首先,生产者端限流可以通过设置 max.request.size 和 compression.type 等参数控制单个请求的大小和压缩方式,减少单个消息的大小。此外,使用 linger.ms 和 batch.size 参数可以控制消息批次大小和发送延迟,平衡吞吐量和资源使用。
消费者端限流主要通过 max.poll.records 和 max.poll.interval.ms 等参数控制单次拉取的消息数量和最大轮询间隔,避免消费者过载。同时,可以通过 fetch.min.bytes 和 fetch.max.wait.ms 控制消费者拉取数据的频率和大小。
Broker 端限流是最关键的限流层。Kafka 2.0 版本引入了基于 Quotas 的限流机制,可以限制客户端、用户或 IP 级别的吞吐量。以下是一个 Broker 端限流配置示例:
# 限制单个客户端的每秒请求数
quota.window.num=10
quota.window.size.seconds=1
# 限制每个用户的每秒消息数量
num.io.threads=8
num.network.threads=8
# 设置特定客户端的限流配置
clients=some_client_id
quota.produce.bytes=-1 # 不限制生产吞吐量
quota.consume.bytes=-1 # 不限制消费吞吐量
quota.request.rate.limit=1000 # 限制每秒请求数为1000
此外,Kafka 还支持通过 KIP-357 实现的网络限流机制,可以限制网络带宽使用。可以通过以下参数配置:
# 网络限流配置(Kafka 2.4+)
quota.window.num=10
quota.window.size.seconds=1
# 限制网络带宽为100MB/s
quota.network.default.bytes=-1
quota.network.throttle.bytes=100000000
除了 Kafka 自带的限流机制,我们还可以结合其他工具实现更精细的限流控制。例如,使用 Nginx 作为 Kafka 的代理层,可以配置限流规则;使用 Prometheus 和 Grafana 监控系统资源,实现基于阈值的自动限流。
下面是不同限流策略的对比表格:
| 限流策略 | 控制维度 | 优点 | 缺点 | 适用场景 |
|———|———|——|——|———|
| 生产者端限流 | 消息大小、批次大小 | 实现简单,无需 Broker 修改 | 无法控制总流量,可能影响消费者 | 对生产速率要求不高的场景 |
| 消费者端限流 | 拉取频率、消息数量 | 减少消费者压力,避免资源耗尽 | 无法控制消息积压,可能影响生产者 | 消费能力不足的场景 |
| Broker 端 Quotas | 客户户级别、用户级别 | 精细控制,支持多种维度 | 配置复杂,需要重启 Broker | 多租户环境,需要精细限流的场景 |
| 网络限流 | 网络带宽 | 控制物理资源使用,防止网络拥塞 | 可能限制合法业务流量 | 带宽受限的网络环境 |
某电商平台在促销活动期间,Kafka 集群处理了数百万订单消息,单个 Broker 上的 Partition 数量达到了 8000 个,遇到了严重的元数据管理问题。以下是他们的解决方案和实际效果。
首先,他们通过以下脚本识别并合并了大量空 Partition:
#!/bin/bash
# 查找空Partition的脚本
echo "查找空Partition…"
kafka-topics.sh –bootstrap-server broker1:9092 –describe | grep -E "\\s0\\s\\s" | cut -d " " -f6 | sort | uniq -c > empty_partitions.txt
# 合并空Partition到现有Topic
while read line; do
count=$(echo $line | awk '{print $1}')
partition=$(echo $line | awk '{print $2}')
topic=${partition%_0} # 假设空Partition的命名规则为topic_0
if [ $count -gt 10 ]; then # 如果空Partition超过10个
kafka-topics.sh –bootstrap-server broker1:9092 –alter –topic $topic –partitions $((count-1))
echo "已合并Topic $topic 的Partition数量为 $((count-1))"
fi
done < empty_partitions.txt
其次,他们优化了 JVM 参数,如下所示:
# 优化后的JVM启动参数
java -Xmx24g -Xms24g -XX:+UseG1GC -XX:MaxGCPauseMillis=150 -XX:ParallelGCThreads=12 -XX:ConcGCThreads=8 -XX:InitiatingHeapOccupancyPercent=30 -XX:G1HeapRegionSize=32m -XX:G1ReservePercent=20 -XX:G1HeapWastePercent=5 -XX:G1MixedGCCountTarget=3 -XX:G1MixedGCLiveThresholdPercent=90 -XX:G1RSetUpdatingPauseTimePercent=5 -XX:SurvivorRatio=8 -XX:+DisableExplicitGC -XX:+UnlockExperimentalVMOptions -XX:+OptimizeStringConcat -XX:+UseStringDeduplication -XX:G1YoungGenerationSizeAdjustment=0.0 -XX:G1NewSizePercent=30 -XX:G1MaxNewSizePercent=50 -Xlog:gc*:file=/var/log/kafka/gc.log:time,tags:filecount=5,filesize=50m -Xlog:gc*:stdout:time,tags -jar kafka-server-start.sh config/server.properties
最后,他们实现了基于 Quotas 的精细化限流控制:
# Broker端的Quotas配置
quota.window.num=10
quota.window.size.seconds=1
# 为不同业务线设置不同的限流规则
clients=order_service,payment_service,inventory_service
# 订单服务限流配置
quota.produce.order_service.bytes=52428800 # 限制生产速率为50MB/s
quota.consume.order_service.bytes=104857600 # 限制消费速率为100MB/s
# 支付服务限流配置(支付服务消息量较小,适当放宽限制)
quota.produce.payment_service.bytes=10485760 # 限制生产速率为10MB/s
quota.consume.payment_service.bytes=52428800 # 限制消费速率为50MB/s
# 库存服务限流配置
quota.produce.inventory_service.bytes=20971520 # 限制生产速率为20MB/s
quota.consume.inventory_service.bytes=41943040 # 限制消费速率为40MB/s
# 通用限流配置
quota.request.rate.limit=1000 # 限制每秒请求数为1000
通过以上优化措施,该电商平台的 Kafka 集群在促销活动期间保持了稳定运行,消息处理延迟从原来的 500ms 降低到 100ms 以内,Broker 的 CPU 使用率从峰值 80% 降低到 60% 以下。
注意事项:
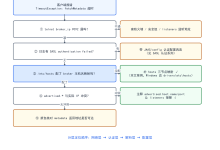
下面是一个 Kafka 集群治理的流程图,展示整个优化过程:
#publish-mermaid-1788403099457-0{font-family:\”trebuchet ms\”,verdana,arial,sans-serif;font-size:16px;fill:#333;}@keyframes edge-animation-frame{from{stroke-dashoffset:0;}}@keyframes dash{to{stroke-dashoffset:0;}}#publish-mermaid-1788403099457-0 .edge-animation-slow{stroke-dasharray:9,5!important;stroke-dashoffset:900;animation:dash 50s linear infinite;stroke-linecap:round;}#publish-mermaid-1788403099457-0 .edge-animation-fast{stroke-dasharray:9,5!important;stroke-dashoffset:900;animation:dash 20s linear infinite;stroke-linecap:round;}#publish-mermaid-1788403099457-0 .error-icon{fill:#552222;}#publish-mermaid-1788403099457-0 .error-text{fill:#552222;stroke:#552222;}#publish-mermaid-1788403099457-0 .edge-thickness-normal{stroke-width:1px;}#publish-mermaid-1788403099457-0 .edge-thickness-thick{stroke-width:3.5px;}#publish-mermaid-1788403099457-0 .edge-pattern-solid{stroke-dasharray:0;}#publish-mermaid-1788403099457-0 .edge-thickness-invisible{stroke-width:0;fill:none;}#publish-mermaid-1788403099457-0 .edge-pattern-dashed{stroke-dasharray:3;}#publish-mermaid-1788403099457-0 .edge-pattern-dotted{stroke-dasharray:2;}#publish-mermaid-1788403099457-0 .marker{fill:#333333;stroke:#333333;}#publish-mermaid-1788403099457-0 .marker.cross{stroke:#333333;}#publish-mermaid-1788403099457-0 svg{font-family:\”trebuchet ms\”,verdana,arial,sans-serif;font-size:16px;}#publish-mermaid-1788403099457-0 p{margin:0;}#publish-mermaid-1788403099457-0 .label{font-family:\”trebuchet ms\”,verdana,arial,sans-serif;color:#333;}#publish-mermaid-1788403099457-0 .cluster-label text{fill:#333;}#publish-mermaid-1788403099457-0 .cluster-label span{color:#333;}#publish-mermaid-1788403099457-0 .cluster-label span p{background-color:transparent;}#publish-mermaid-1788403099457-0 .label text,#publish-mermaid-1788403099457-0 span{fill:#333;color:#333;}#publish-mermaid-1788403099457-0 .node rect,#publish-mermaid-1788403099457-0 .node circle,#publish-mermaid-1788403099457-0 .node ellipse,#publish-mermaid-1788403099457-0 .node polygon,#publish-mermaid-1788403099457-0 .node path{fill:#ECECFF;stroke:#9370DB;stroke-width:1px;}#publish-mermaid-1788403099457-0 .rough-node .label text,#publish-mermaid-1788403099457-0 .node .label text,#publish-mermaid-1788403099457-0 .image-shape .label,#publish-mermaid-1788403099457-0 .icon-shape .label{text-anchor:middle;}#publish-mermaid-1788403099457-0 .node .katex path{fill:#000;stroke:#000;stroke-width:1px;}#publish-mermaid-1788403099457-0 .rough-node .label,#publish-mermaid-1788403099457-0 .node .label,#publish-mermaid-1788403099457-0 .image-shape .label,#publish-mermaid-1788403099457-0 .icon-shape .label{text-align:center;}#publish-mermaid-1788403099457-0 .node.clickable{cursor:pointer;}#publish-mermaid-1788403099457-0 .root .anchor path{fill:#333333!important;stroke-width:0;stroke:#333333;}#publish-mermaid-1788403099457-0 .arrowheadPath{fill:#333333;}#publish-mermaid-1788403099457-0 .edgePath .path{stroke:#333333;stroke-width:1px;}#publish-mermaid-1788403099457-0 .flowchart-link{stroke:#333333;fill:none;}#publish-mermaid-1788403099457-0 .edgeLabel{background-color:rgba(232,232,232, 0.8);text-align:center;}#publish-mermaid-1788403099457-0 .edgeLabel p{background-color:rgba(232,232,232, 0.8);}#publish-mermaid-1788403099457-0 .edgeLabel rect{opacity:0.5;background-color:rgba(232,232,232, 0.8);fill:rgba(232,232,232, 0.8);}#publish-mermaid-1788403099457-0 .labelBkg{background-color:rgba(232, 232, 232, 0.5);}#publish-mermaid-1788403099457-0 .cluster rect{fill:#ffffde;stroke:#aaaa33;stroke-width:1px;}#publish-mermaid-1788403099457-0 .cluster text{fill:#333;}#publish-mermaid-1788403099457-0 .cluster span{color:#333;}#publish-mermaid-1788403099457-0 div.mermaidTooltip{position:absolute;text-align:center;max-width:200px;padding:2px;font-family:\”trebuchet ms\”,verdana,arial,sans-serif;font-size:12px;background:hsl(80, 100%, 96.2745098039%);border:1px solid #aaaa33;border-radius:2px;pointer-events:none;z-index:100;}#publish-mermaid-1788403099457-0 .flowchartTitleText{text-anchor:middle;font-size:18px;fill:#333;}#publish-mermaid-1788403099457-0 rect.text{fill:none;stroke-width:0;}#publish-mermaid-1788403099457-0 .icon-shape,#publish-mermaid-1788403099457-0 .image-shape{background-color:rgba(232,232,232, 0.8);text-align:center;}#publish-mermaid-1788403099457-0 .icon-shape p,#publish-mermaid-1788403099457-0 .image-shape p{background-color:rgba(232,232,232, 0.8);padding:2px;}#publish-mermaid-1788403099457-0 .icon-shape .label rect,#publish-mermaid-1788403099457-0 .image-shape .label rect{opacity:0.5;background-color:rgba(232,232,232, 0.8);fill:rgba(232,232,232, 0.8);}#publish-mermaid-1788403099457-0 .label-icon{display:inline-block;height:1em;overflow:visible;vertical-align:-0.125em;}#publish-mermaid-1788403099457-0 .node .label-icon path{fill:currentColor;stroke:revert;stroke-width:revert;}#publish-mermaid-1788403099457-0 .node .neo-node{stroke:#9370DB;}#publish-mermaid-1788403099457-0 [data-look=\”neo\”].node rect,#publish-mermaid-1788403099457-0 [data-look=\”neo\”].cluster rect,#publish-mermaid-1788403099457-0 [data-look=\”neo\”].node polygon{stroke:#9370DB;filter:drop-shadow(1px 2px 2px rgba(185, 185, 185, 1));}#publish-mermaid-1788403099457-0 [data-look=\”neo\”].swimlane.cluster rect{filter:none;}#publish-mermaid-1788403099457-0 [data-look=\”neo\”].node path{stroke:#9370DB;stroke-width:1px;}#publish-mermaid-1788403099457-0 [data-look=\”neo\”].node .outer-path{filter:drop-shadow(1px 2px 2px rgba(185, 185, 185, 1));}#publish-mermaid-1788403099457-0 [data-look=\”neo\”].node .neo-line path{stroke:#9370DB;filter:none;}#publish-mermaid-1788403099457-0 [data-look=\”neo\”].node circle{stroke:#9370DB;filter:drop-shadow(1px 2px 2px rgba(185, 185, 185, 1));}#publish-mermaid-1788403099457-0 [data-look=\”neo\”].node circle .state-start{fill:#000000;}#publish-mermaid-1788403099457-0 [data-look=\”neo\”].icon-shape .icon{fill:#9370DB;filter:drop-shadow(1px 2px 2px rgba(185, 185, 185, 1));}#publish-mermaid-1788403099457-0 [data-look=\”neo\”].icon-shape .icon-neo path{stroke:#9370DB;filter:drop-shadow(1px 2px 2px rgba(185, 185, 185, 1));}#publish-mermaid-1788403099457-0 :root{–mermaid-font-family:\”trebuchet ms\”,verdana,arial,sans-serif;}元数据压力大性能差稳定性问题
开始
评估集群状态
发现问题
分析元数据分布
检查GC日志
监控系统指标
合并空Partition
合理分配Partition
优化JVM参数
设置合理堆大小
选择合适GC
实现限流机制
配置Quotas
监控流量
验证效果
持续优化
结束